


Gold has been bright and shining star since December 12 rallying nearly 3%. Though we were previously forecasting lower levels and a potential retest of $1200, we changed our tune in the December 18 US Opening Bell webinar suggesting that the near term down trend appears to have ended.
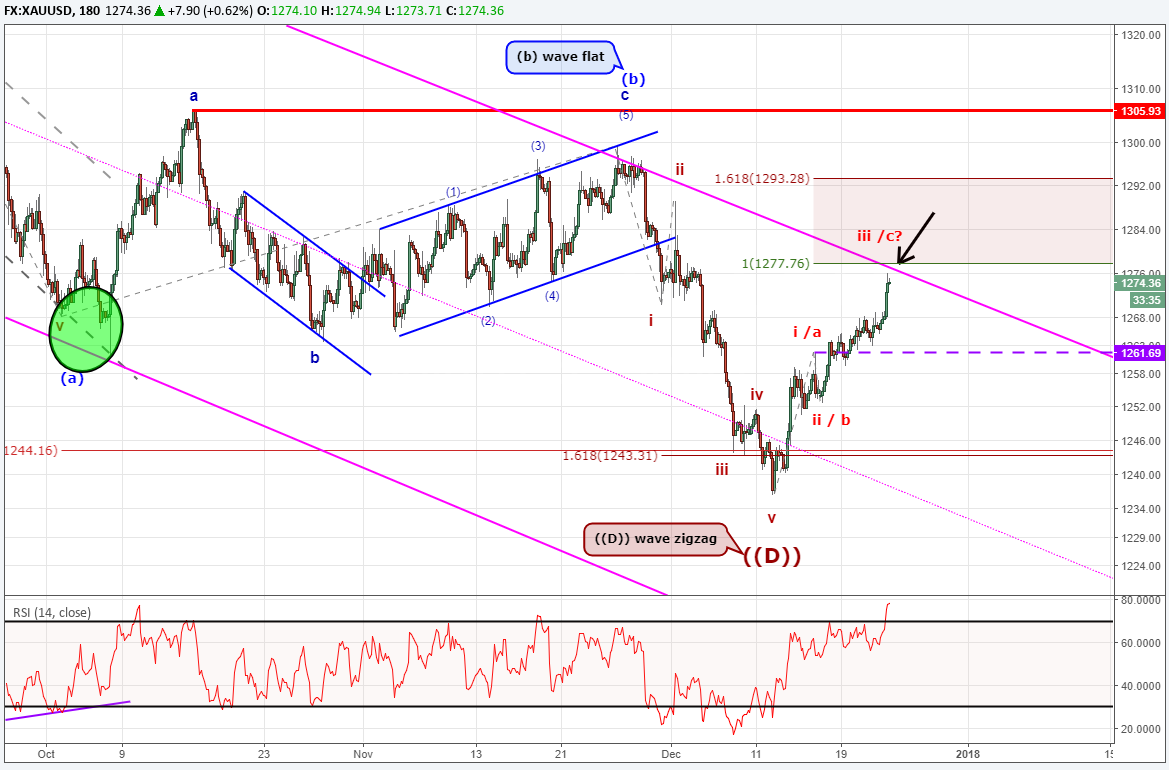
Gold prices have rallied to a level that makes things interesting for the next few days. There are two levels of resistance forming near $1276-$1277. We have downward sloping trend channel line shaped from the September to December 2017 zigzag pattern. Additionally, at smaller degree, an equal wave relationship exists near $1277.
Be mindful of a reaction lower early next week at this price zone. We do think this level eventually breaks higher in an impulsive wave. The key price to watch is the $1262 purple dotted line. So long as gold prices are above this level, we think the current wave extends higher towards $1293.
If a stronger reaction lower drives below $1262, then one option we are considering is an extension lower of the ((D)) wave towards our original target levels. We think this is lower probability now as this current wave higher has overlapped the October 2017 lows. That overlap negates a large bearish impulse and leaves the door open to higher levels.
Struggling with your trading? This could be why.
Gold Price Chart with Elliott Wave Analysis
From a sentiment perspective, the ratio of net long to net short traders has remained positive and currently reads +3.3. This indicates the majority of traders are positioned net long in gold. The number of traders net long has changed little for the past 2 months that follows the lack of gold price trend. Follow the sentiment of live traders through our sentiment page.
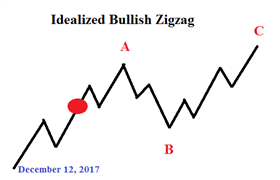
The bottom line is we look for gold prices continue its shorter trend higher towards $1300 in a bullish zigzag pattern. We are viewing dips to be temporary and partial retracements with buying pressure eventually coming back. The key level for this analysis is the December 15 high of $1262. Below $1262, we will need to reassess the Elliott wave count.
Learn more about the Elliott Wave patterns by receiving our beginner and advanced Elliott Wave guides.
---Written by Jeremy Wagner, CEWA-M
Jeremy is a Certified Elliott Wave Analyst with a Master’s designation. These articles are designed to illustrate Elliott Wave applied to the current market environment.
Discuss this market with Jeremy in a special year-end webinar on December 27 “What 2 Watch 4 in 2018”.
Follow on twitter @JWagnerFXTrader .
Join Jeremy’s distribution list.
Recent Elliott Wave articles by Jeremy:
EURUSD Elliott Wave Pattern Looks to Higher Levels
NZDUSD Elliott Wave Analysis: Fourth Wave Close to Terminating


