


Daily
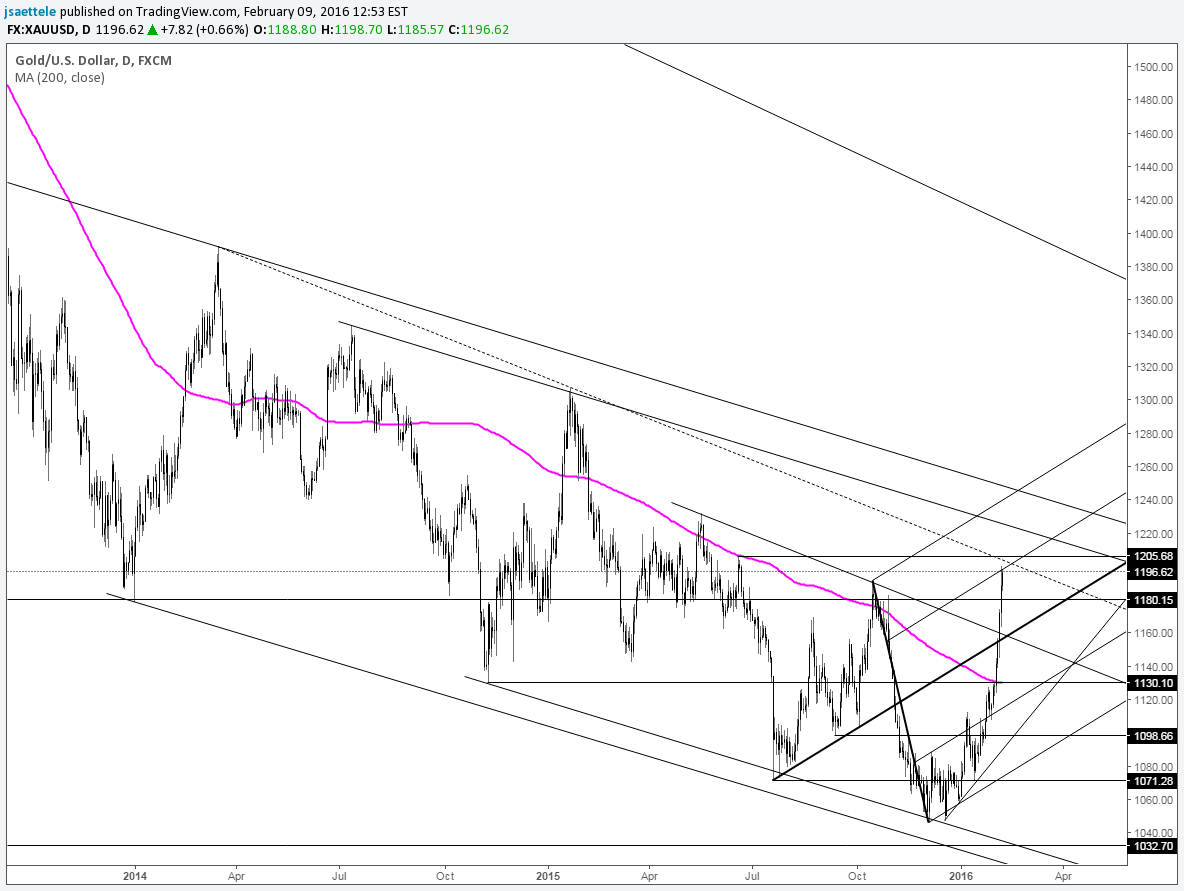
Chart Prepared by Jamie Saettele, CMT
DailyFX Trading Guides and Forecasts
-The last update noted that “1130 (2014 low and close to the 200 day avg) does loom as resistance for the gold price. A break above 1130 would be viewed as a positive in what may be an attempt at forming a major bottoming pattern.” Gold accelerated higher after breaking 1130 and the metal is now at its highest level since last June. The line that extends off of the 2014 and 2015 highs is just above spot as is the June 2015 high. The well-defined level may engender a pullback.
For more analysis and trade setups (exact entry and exit), visit SB Trade Desk


