


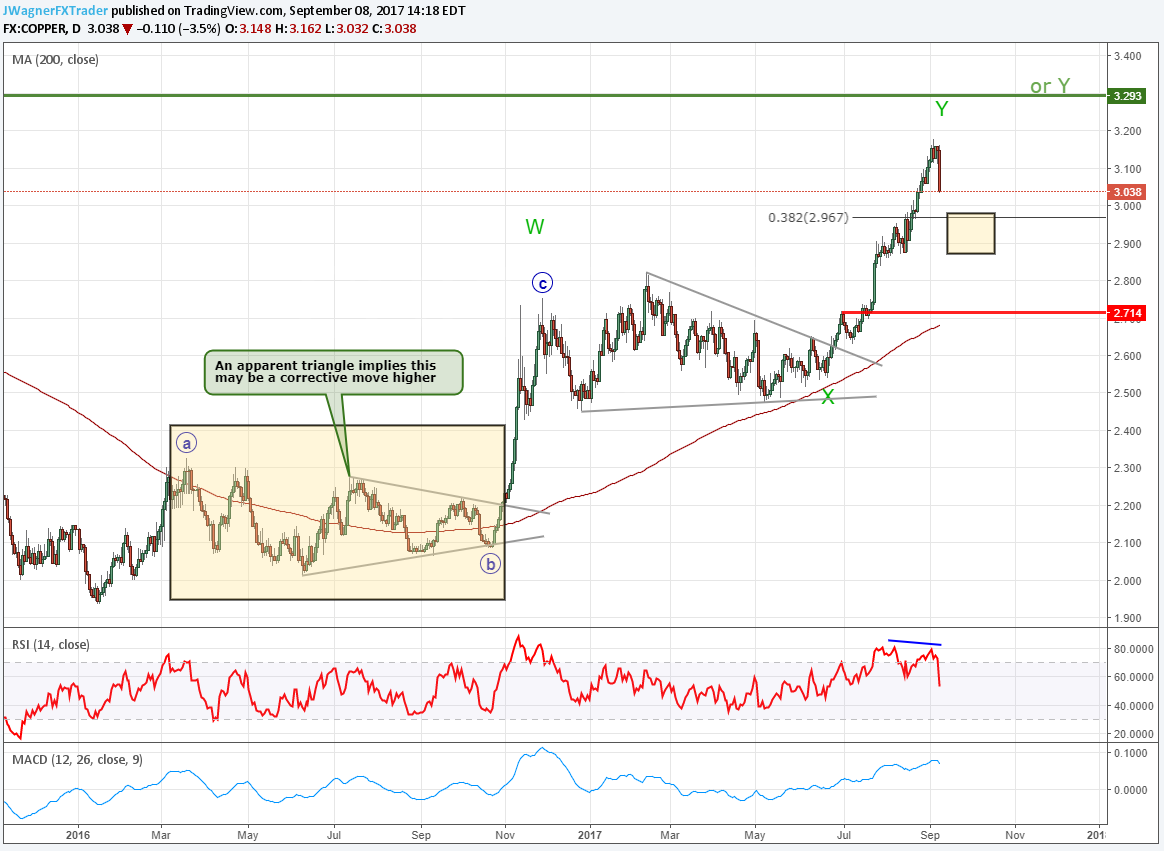
Copper prices have sold off hard today with a 3.5% down move. The Elliott Wave model we are following on copper prices suggest a correction may dig a little deeper towards 2.85 – 2.97.
In the chart below, the higher probability Elliott Wave count we are following is that the move higher in copper from the January 2016 low is a complex correction labeled W-X-Y. The clue of this being a big corrective move higher is the triangle highlighted in 2016. You see, there are specific locations where triangles appear in the Elliott Wave sequence. With a triangle, appearing that early in a new trend higher suggests the move is corrective and likely retraced in the future.
Do you want more in depth study on Elliott Wave Triangle patterns? Watch this one hour long webinar recording that is devoted to the Elliott Wave triangle pattern s.
If this wave count is correct, then we are currently in the ‘Y’ wave of the W-X-Y complex correction. It is unclear whether the ‘Y’ wave is finished or not. If the wave is complete and over, then we are in the early stages of a large sell off.
If the ‘Y’ wave is not complete, then a correction in copper prices to 2.85-2.97 is typical and normal. If copper prices move below 2.71, then that will serve as an early warning signal that a top may be in place and the larger down trend is beginning.
Interested in learning more about Elliott Wave Theory? Review the beginner and advanced Elliott Wave guides.
Copper Price Elliott Wave Chart
---Written by Jeremy Wagner, CEWA-M
Discuss this market with Jeremy in Monday’s US Opening Bell webinar.
Follow on twitter @JWagnerFXTrader .
Join Jeremy’s distribution list.


