Don’t hold your breath as Indices are not done declining yet. Russell 2000 appears to have further price action left prior to bottoming out.
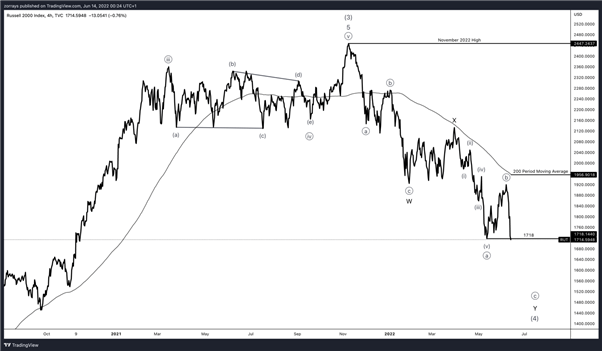
As of November 2022, Russell 2000 has deflated nearly 30% of its gains up to now. To top it up, it recently has broken through the 1718 key level. This is a good indication that further decline awaits within the near-term future.
Lets take a closer look at a 4 hour timeframe chart

According to my Elliott Wave count, this is still playing within an incomplete bearish sequence as it unfolds a Double Correction. This is when two corrective patterns combine into one corrective cycle. In Russell 2000’s case, there are two Zig-Zag patterns merged into this Double Correction with Wave X as the connector.
At present, Russell 2000 is playing within wave ((c)) of Y to the downside as per shown on the above chart. Therefore, according to the most recent price action, expecting a further decline unfolding in a 5-wave sequence is feasible.
To rub the salt into the wound, price is still hovering below the 200-period Moving Average. Subsequently, if it remains beneath the 200-period Moving Average, we can safely say that Russell 2000 will remain bearish.
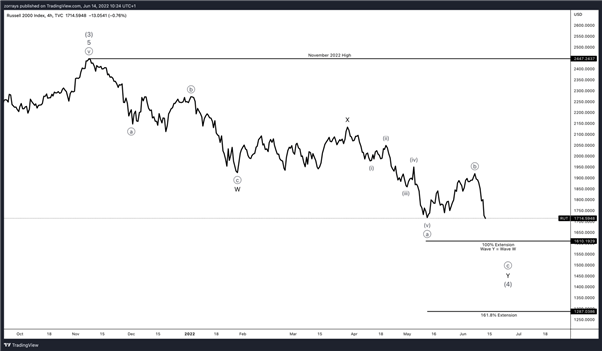
How can we Fibonacci Extension to determine a target range of wave Y?

With Double Corrections, the relationship between Wave W and Y is usually based on equality. This means Wave Y can equal the same length as wave W. This is not limited to going as deep as 161.8% extension. According to Russell 2000’s Double Correction, we can expect Wave Y to complete within the range of 1610 – 1287.
Would this bottom out after the Double Correction is done?
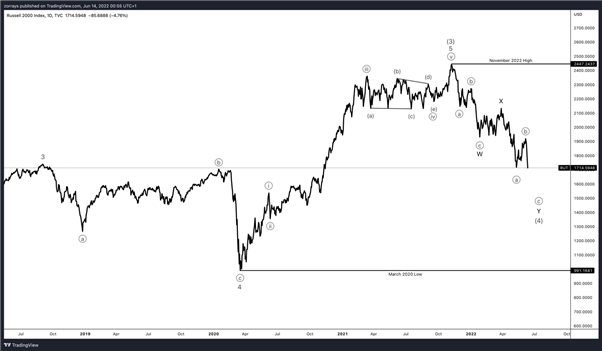
Simply put, not necessarily. However, a more complex answer would be that this could also be the beginning of a corrective cycle on a higher degree across US Indices. In the next chart, I will be explaining on how to apply Elliott Wave’s guidelines to determine the depth of Wave 4 correction.

In March 2020, as Covid-19 pandemic was drastically spreading across the globe, Russell 2000 was pushed all the down to 991. This formed Wave 4 of (3).
As Russell 2000 is unfolding wave (4) on a higher degree, the guideline of wave 4 correction usually can retrace up to wave 4 on a lower degree of the preceding wave. Therefore, the Russell 2000 can go as low as 991 according to this guideline.
To sum it up, taking the target range for the Double Correction and Wave 4 depth guideline into consideration, I am wary that this correction may not be done once we complete wave Y. There is a good chance that this could be the beginning for a larger Double Correction on a higher degree.


