


US Dollar Talking Points:
- The US Dollar has hit a fresh 20-year high in this morning’s session.
- This marks an astounding move that’s come back into play around the June open. The US Dollar bullish trend took a two-week-break, and rumors of the Dollar’s demise were greatly overstated as the Greenback has come roaring back in the month of June, helped along by a passive ECB and still-surging inflation in the United States.
- The analysis contained in article relies on price action and chart formations. To learn more about price action or chart patterns, check out our DailyFX Education section.

Things change fast in markets. Just a few trading days ago we were talking about U.S. equities trading in ranges and the US Dollar still in a pullback. And that pullback lasted pretty much into the June open.
That’s all changed after the ECB rate decision on Thursday. Despite the fact that inflation is running at over 8% in Europe, the European Central Bank seems to be fairly passive about the matter and not too concerned about hiking rates. As the ECB took on that dovish tone, EUR/USD began to tank and accordingly the US Dollar shot through an ascending triangle formation.
US Dollar Two-Hour Chart: Ascending Triangle Breakout, Fresh Highs

Chart prepared by James Stanley; USD, DXY on Tradingview
That breakout has pretty much continued to run ever since, with a pause over the weekend followed by a continuation of strength that’s amounted to a fresh 20-year-high on the US Dollar.
At this point, the US Dollar has set a fresh 20-year high but bulls have started to shy away as prices tested over the 105.00 psychological level.
US Dollar Daily Price Chart

Chart prepared by James Stanley; USD, DXY on Tradingview
US Dollar: What’s Next?
At this point, we’re seeing a bit of resistance after that fresh high and the test of prior resistance. This brings up the possibility of a cup-and-handle type of pattern. Such a move will often show ahead of bullish breakouts, where resistance begins to play on the re-test of highs, and that can lead to a bit of a pullback.
Given how stretched markets have become ahead of the Wednesday FOMC rate decision, this could be an attractive way of moving forward with bullish USD scenarios at this point. The quandary is that a pullback hasn’t really begun yet, so there’s quite a bit of projection that’s required here and, frankly, there’s been so much emotion in this move that bulls may not be ready to wait around.
So, I’m going to look at the USD from a couple of vantage points. First and foremost, breakout potential remains; so if the pullback doesn’t price in and bulls continue to push, traders can look at bullish breakout scenarios which would likely be feeding from a bearish EUR/USD scenario. The low of 1.0340 has remained unfettered for now, but once that gives way I’m expecting a strong jump in the USD.

But – if a pullback can price in, there’s an area of prior swing highs/lows that’s of interest and I’m plotting that from around 104.22-104.41. If that doesn’t hold, there’s a prior resistance level around 103.82 that could suffice, as well.
US Dollar Four-Hour Price Chart
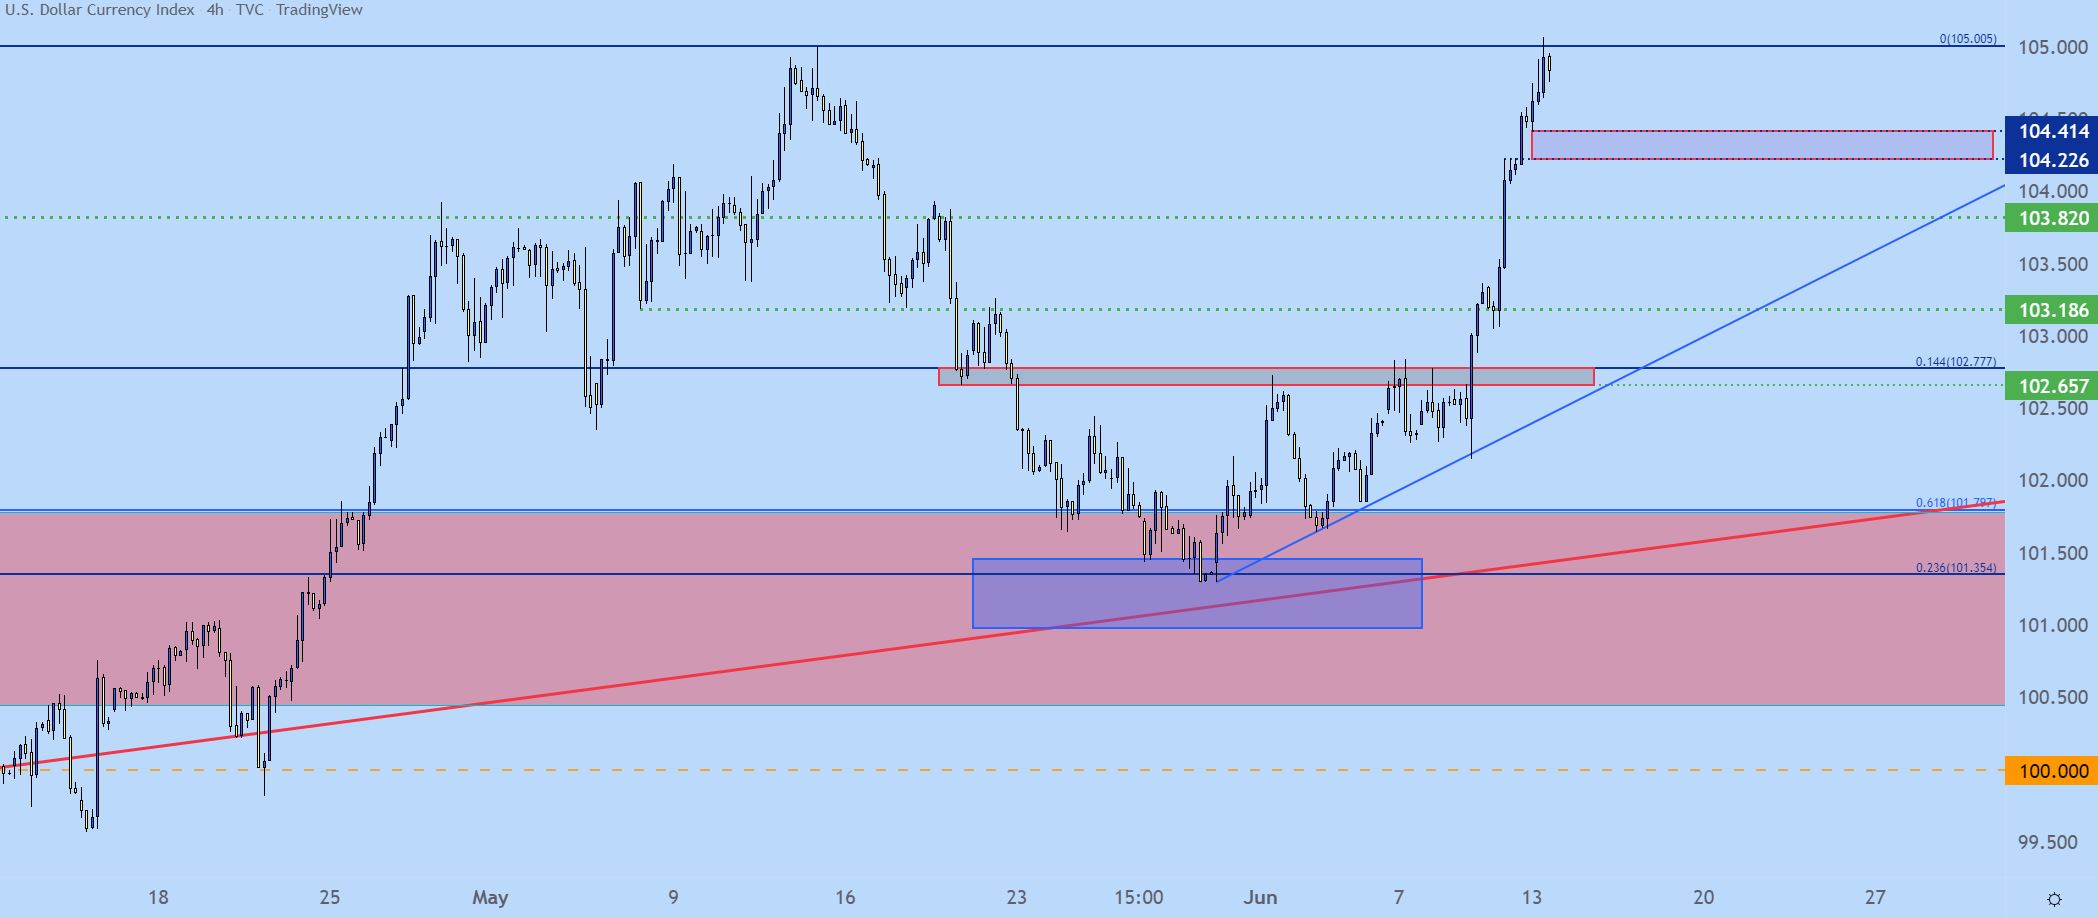
Chart prepared by James Stanley; USD, DXY on Tradingview
--- Written by James Stanley, Senior Strategist for DailyFX.com
Contact and follow James on Twitter: @JStanleyFX


