


Euro, EUR/USD, US Dollar, EUR/JPY, Japanese Yen - Talking points
- EUR/USD has consolidated since lifting off a 5-year low
- Yen depreciation has seen EUR/JPY boosted to new highs
- If EUR/USD clears nearby resistance, will it continue north?

EUR/USD TECHNICAL ANALYSIS
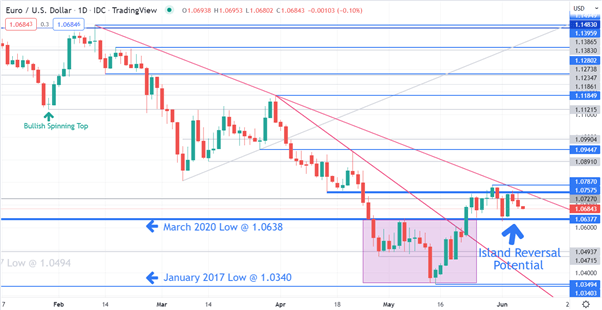
After failing to break below the January 2017 low of 1.0340, EUR/USD has staged a rally that has broken back above a descending trend line.
This move has seen the price set up a potential island reversal. While it has so far made a move above a break point at 1.0638, a clean break above 1.0758 is needed to confirm the potential of the reversal.
It tried to move above 1.0758 but failed and now has a descending trend line near that historical break point (1.0758) and the recent high of 1.0787 to overcome in order to re-iterate a potential reversal.
If it breaks above those resistance levels, it may push toward further resistance at 1.0936 and 1.0945.
An island reversal in stock prices would see a few candlesticks in isolation from the rest of the price. This is because the stock price closes at the end of each trading day for the night and then re-opens the next morning, allowing for gaps in the price chart.
FX markets roll from one close immediately into the next day open at 5pm New York time, Monday to Friday. This means that the gap in FX pricing for an island reversal still sees a body in the candlestick.
Support could be at 1.0638 or the previous lows of 1.0627, 1.0349 and 1.0340.
Introduction to Technical Analysis
Learn Technical Analysis
Recommended by Daniel McCarthy
EUR/JPY TECHNICAL ANALYSIS
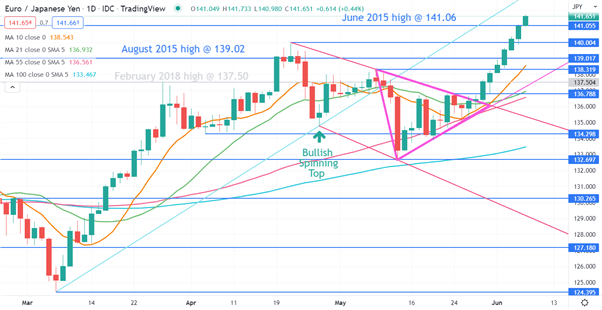
EUR/JPY has made a 7-year high today with Yen weakness remerging. After breaking below an ascending trend line last month, it has established a new ascending trend line.
In this move, the cross rate broke the topside of a Pennant formation.
Momentum appears to have re-accelerated with the 10-, 21-, 55- and 100-day simple moving average (SMA) all below the price and exhibiting positive gradients.
There looks to be a lot of clean air before the December 2014 peak of 149.78.
Previous points of resistance might now be support levels at 141.06, 140.00, 139.02 and 138.32.
--- Written by Daniel McCarthy, Strategist for DailyFX.com
To contact Daniel, use the comments section below or @DanMcCathyFX on Twitter


