


Japanese Yen, USD/JPY, US Dollar, EUR/JPY, Euro - Talking Points
- USD/JPY remains range bound after a move lower lacked follow through
- EUR/JPY direction might have clues in narrowing daily ranges making a pennant
- Yen weakening has paused, but the question remains, is it a turn or trend stall?
Introduction to Technical Analysis
Learn Technical Analysis
Recommended by Daniel McCarthy
USD/JPY
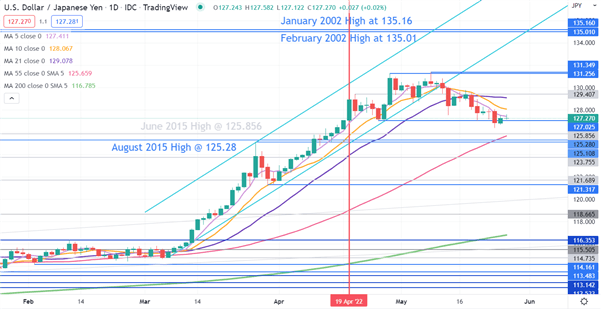
Two days ago, USD/JPY nudged below a previous low that had held last week. The break was short lived and reversed yesterday.
It questioned the bearish potential of the move and maintains a range trading type environment. Prior to this set-up, USD/JPY had been in an ascending trend channel.
The 19th April was the day that JPY was at its historical lowest ebb against the CNY. When that CNY/JPY peak was made, China started to devalue CNY via USD/CNY and consequently, JPY stopped weakening more broadly.
Since then, short term momentum appears to have rolled over with the 5-, 10-, and 21-day simple moving averages (SMA) below the price and turning from positive to negative gradients.
The 5- and 10-day SMAs have crossed below the 21-day SMA, indicating a Death Cross.
On the other side of the equation, medium and long-term SMAs remain below the price and maintain positive gradients as shown by the 55- and 200-day SMAs.
This could suggest that short-term bearish momentum is conflicting with underlying medium and long-term bullish momentum.
On the topside, a break above the recent 20-year high of 131.25 may see it test a possible resistance zone at the January and February 2002 highs of 135.01 – 135.16.
Support might lie at the break points of 125.28 and 125.10.

EUR/JPY
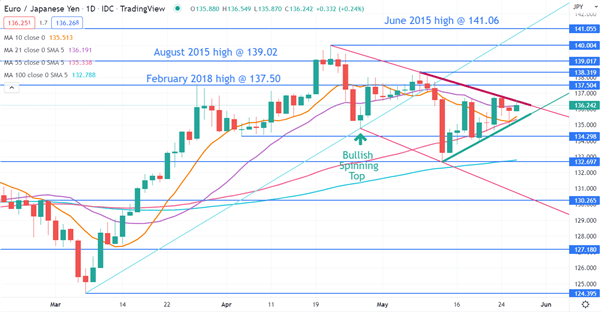
EUR/JPY made a 7-year high last month and from that peak a descending trend line can be drawn crossing to consequent highs.
After making a low at 132.70 two weeks ago, the price has been making higher lows and an ascending trend line can be drawn from that initial low.
These two trend lines have set up a potential bearish Pennant Formation. A break below the ascending trend line would confirm this.
Bearish momentum may further evolve as it would also be breaking below the 10-, 21 and 55-day simple moving averages (SMA).
Support could be at the prior low of 132.70 that also currently coincides with the 100-day SMA.
On the topside, resistance could be at the recent peaks of 138.32 and 140.00 or the June 2015 high of 141.06.
--- Written by Daniel McCarthy, Strategist for DailyFX.com
To contact Daniel, use the comments section below or @DanMcCathyFX on Twitter


