


Euro, EUR/USD, US Dollar, Momentum - Talking points
- EUR/USD has paused on its bearish run, but momentum is lurking
- Some historical levels have confirmed the recent EUR/USD move
- What would a new low in EUR/USD mean going forward?

EUR/USD TECHNICAL ANALYSIS
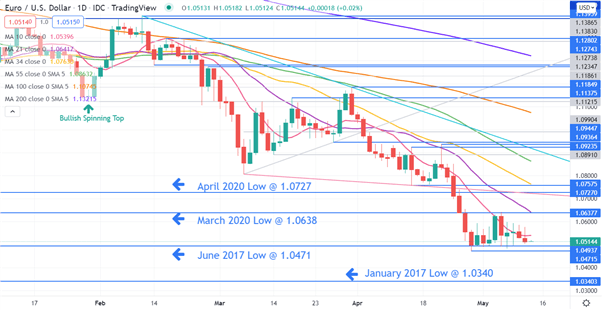
EUR/USD continues to bump along 5-year lows after cleanly breaking below the March 2020 low of 1.0638.
Previous lows and highs can be useful for traders in risk management and confirmation or otherwise of momentum. Historically, the price rarely stops and turns at a previous high or low.
If the prior high or low is breached cleanly, that is when the price has continued to run through and closed a notable distance from the level, then it could confirm unfolding momentum in that direction.
If the price pierces the historical high or low by only a small margin, but is unable to close on the other side, this may indicate that momentum is stalling.
In the case of EUR/USD recently, the run down breached cleanly through the April and March 2020 lows of 1.0727 and 1.0638 respectively.
It continued lower and traded below the June 2017 low of 1.0494, but only by a small margin and it never closed below the June 2017 low. Bearish momentum has stalled in the 2-weeks since then.
Introduction to Technical Analysis
Learn Technical Analysis
Recommended by Daniel McCarthy
Today, if the price stays above its current level, the gradient on short-term 10-day simple moving average (SMA) will turn from negative to positive. This could indicate a pause in bearish momentum.
Although, if the price slips lower from here, the gradient of the 10-day SMA will remain negative, alongside the 21-, 34-, 55-, 100- and 200-day SMAs.
A bearish triple moving average (TMA) formation requires the price to be below the short term SMA, the latter to be below the medium term SMA and the medium term SMA to be below the long term SMA. All SMAs also need to have a negative gradient.
Looking at any combination of the 21-, 34, 55-, 100- and 200-day SMAs, the criteria for a TMA will be met.
A close below the June 2017 low will make the gradient on the 10-day negative and further bearish momentum may unfold.
Support might be near the January 2017 low of 1.0340 or the recent low of 1.0471. On the topside, resistance could be at the historical level of 1.0638, which also has the 21-day SMA bisecting it.
--- Written by Daniel McCarthy, Strategist for DailyFX.com
To contact Daniel, use the comments section below or @DanMcCathyFX on Twitter


