


Euro, EUR/USD, US Dollar - Talking points
- EUR/USD has given up gains this week as support waivers in the range
- The Euro appears set to test the recent low as technical signals turn
- With momentum building, is there a breakout unfolding for EUR/USD?
Trade Smarter - Sign up for the DailyFX Newsletter
Receive timely and compelling market commentary from the DailyFX team
EUR/USD TECHNICAL OUTLOOK
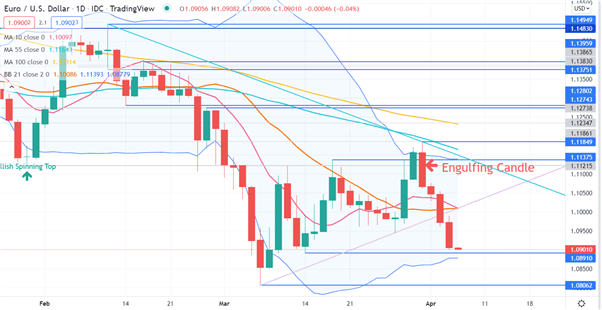
EUR/USD has collapsed to start this week and broken below several levels. Notably, it is now trading below the 10- and 21-day simple moving average (SMA) and moved below an ascending trend line.
The 10-day SMA is poised to move below the 21-day SMA which would be a short term Death Cross. Technical traders typically look for wider gap in the tenure of the SMAs for a Death Cross, but here it is potentially confirming bearish momentum.
The 55- and 100-day SMAs are above the price. A bearish triple moving average (TMA) formation requires the price to be below the short term SMA, the latter to be below the medium term SMA and the medium term SMA to be below the long term SMA. All SMAs also need to have a negative gradient.
While using either of the 10- or 21-day SMAs as the short-term SMA would fulfil the criteria for a TMA, the correct order at the short-end ensures uniformity.
Introduction to Technical Analysis
Learn Technical Analysis
Recommended by Daniel McCarthy
The price is currently questioning the previous low of 1.0891 and a move below there could see a test of the 2-year low at 1.0806.
The rally last week stalled just below the 55-day SMA and that high of 1.1185 might be in a zone of resistance. There is a descending trend line, currently dissecting at 1.1145, as well as the 55 and 100-day SMAs.
The rejection of the rally was confirmed by a Bearish Engulfing Candle.
Further resistance could be at the previous highs and pivot points of 1.1274, 1.1280, 1.1375, 1.1396, 1.1483 and 1.1495.
The upper band of the 21-day simple moving average (SMA) based Bollinger Band coincides with a potential resistance level of 1.1138.
The move back to the middle of the 1-month range has seen volatility decrease, as illustrated by the narrowing of the Bollinger Bands. A breakout of the 1.0806 – 1.1185 range could see an increase in volatility.
EUR/USD DAILY CHART
--- Written by Daniel McCarthy, Strategist for DailyFX.com
To contact Daniel, use the comments section below or @DanMcCathyFX on Twitter


