


Euro, EUR/USD, EUR/JPY - Talking points
- EUR/USD has taken a breather after an astonishing run higher
- Likewise, EUR/JPY has historical resistance hindering momentum
- Euro appears to be consolidating for now. Will the up-trend resume?
Trade Smarter - Sign up for the DailyFX Newsletter
Receive timely and compelling market commentary from the DailyFX team
EUR/USD TECHNICAL OUTLOOK
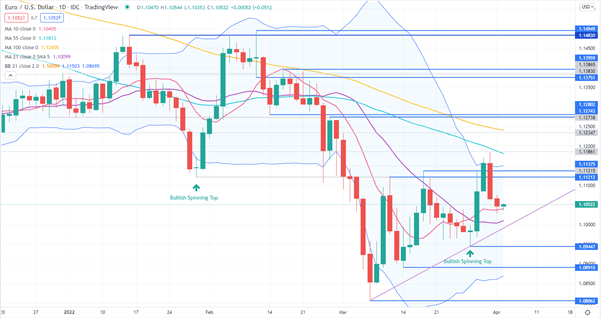
The rally from the 2-year low in March saw EUR/USD break through the topside of the 21-day simple moving average (SMA) based Bollinger Band.
It was unable to sustain the move and has now moved back inside the band, which could signal a pause in bullish momentum.
The move up stalled just before the 55-day SMA and it may continue to offer resistance, currently dissecting at 1.1181. The 100-day SMA could also offer resistance just above it, presently at 1.1240.
The retreat has seen the price attempt to move below the 10-day SMA, but it was unable to follow through. A close below the 10-day SMA would add further evidence of a slowing in bullish momentum. Just below there, the 21-day SMA may provide support, currently at 1.1010.
The overall picture of the price residing between the short-term SMAs on the downside, and the medium and long-term SMAs on the topside, suggests that there could be a period of consolidation and range trading conditions ahead.
Further evidence of this could be the reduction in volatility, as illustrated by the narrowing of the 21-day SMA based Bollinger Band.
A conclusive move breaking through the SMAs on either side of the price may see further momentum evolve in that direction.
Support might be at the previous lows of 1.09447, 1.08910 and 1.08062. Potential support may also lie at an ascending trend line, currently intersecting near 1.1000.
Resistance could be at the previous highs and pivot points of 1.11375, 1.11849, 1.12743 and 1.12802.
Introduction to Technical Analysis
Learn Technical Analysis
Recommended by Daniel McCarthy
EUR/JPY TECHNICAL ANALYSIS
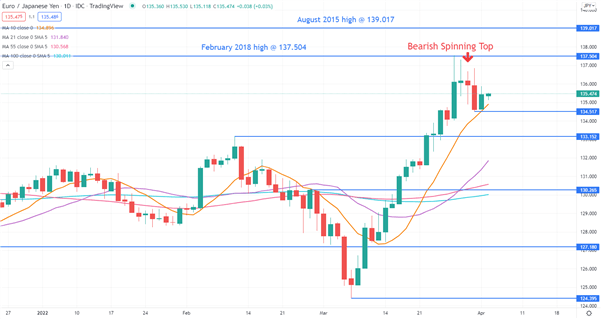
EUR/JPY bumped up against the February 2018 peak of 137.504 last week but was unable to break above it. That level may continue to offer resistance, as well as the August 2015 high of 139.017.
Two days after last week’s zenith, a Spinning Top Candlestick formation was observed and might suggest near term weakness in the price may unfold.
Having said that, a broader perspective might reveal that some bullish momentum remains intact.
A bullish triple moving average (TMA) formation requires the price to be above the short term SMA, the latter to be above the medium term SMA and the medium term SMA to be above the long term SMA. All SMAs also need to have a positive gradient.
Looking at the 10, 21, 55 and 100-day SMAs, the criteria for a bullish TMA have been met.
Nearby support could be at the 10-day SMA or the recent low of 134.517.
--- Written by Daniel McCarthy, Strategist for DailyFX.com
To contact Daniel, use the comments section below or @DanMcCathyFX on Twitter


