


Euro, EUR/USD, EUR/NOK - Talking points
- EUR/USD bursts higher this week, creating short-term momentum
- EUR/NOK has bounced off fresh lows but still might be vulnerable
- Euro has made some gains this week, but resistance lies ahead
Trade Smarter - Sign up for the DailyFX Newsletter
Receive timely and compelling market commentary from the DailyFX team
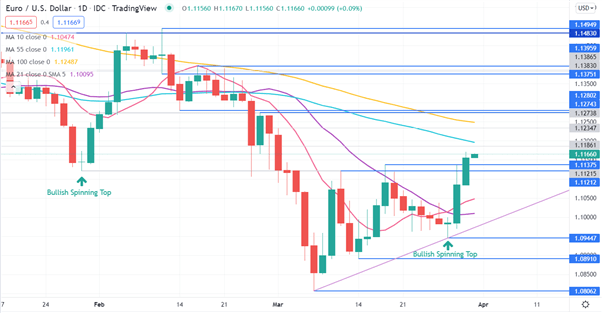
EUR/USD TECHNICAL OUTLOOK
Since making a 2-year low in early March at 1.0806, EUR/USD has been making higher highs and lows to create short-term bullish momentum.
This is indicated by the price being above the 10 and 21-day simple moving average (SMA) and their gradients both being positive.
Medium and long-term SMAs remain above the price with negative gradients, indicating medium and long-term bearish momentum.
This places EUR/USD at some somewhat of a crossroads, momentum wise. A conclusive break below the 10 and 21-day SMAs may suggest a resumption of bearish momentum.
On the topside, the price would need to move above the 55 and 100-day SMAs for longer, due to their longer duration, to suggest bullish momentum across all time period SMAs.
Resistance could be at the previous highs and pivot points of 1.12743, 1.12802, 1.13751, 1.13959, 1.14830 and 1.14949.
Nearby support might be at the previous resistance levels of 1.11212 and 1.11375. Further below, the previous lows of 1.09447, 1.08910 and 1.08062 are potential support.
Support may also lie at an ascending trend line, currently intersecting at 1.0975.
Introduction to Technical Analysis
Learn Technical Analysis
Recommended by Daniel McCarthy
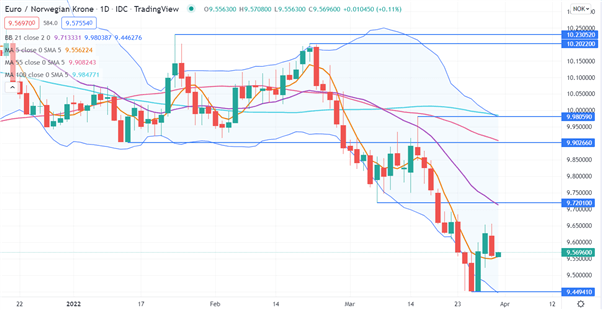
EUR/NOK TECHNICAL ANALYSIS
EUR/NOK traded at its lowest level since October 2018 this week as the intra-Europe currency pair highlights the differences between energy importer and energy exporter economies.
In making that low, the price closed outside the lower band of the 21-day simple moving average (SMA) based Bollinger Band. The close on Monday was back inside the band, which could suggest that downward momentum has paused for now.
The rally over the last few days has seen the price trade above the 5-day SMA and if that continues, short-term momentum may have some upside.
A break below it might see bearish momentum resume. Support could be at the recent low of 9.44941
The 21, 55 and 100-day SMAs are all near potential resistance levels at 9.7201, 9.90266 and 9.98959 respectively.
--- Written by Daniel McCarthy, Strategist for DailyFX.com
To contact Daniel, use the comments section below or @DanMcCathyFX on Twitter


