


Japanese Yen, USD/JPY, AUD/JPY - Talking Points
- USD/JPY made a 6-year high last month and might gain momentum to climb again
- AUD/JPY pulled back from its’ January peak and appears to lack direction
- JPY appears to have different paths against AUD and USD. Will Yen weaken?
Introduction to Technical Analysis
Learn Technical Analysis
Recommended by Daniel McCarthy
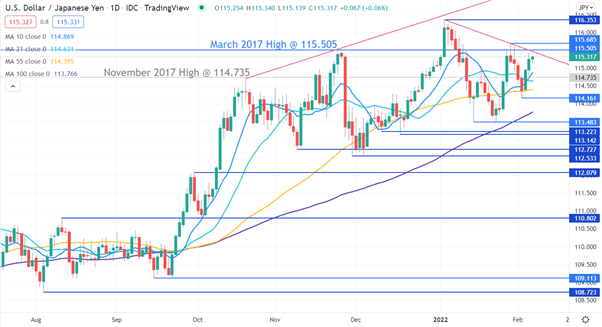
USD/JPY – Technical Analysis
USD/JPY is rallying toward a descending trend line which is just below the pivot point resistance level at 115.505.
A break above there could see the resistance levels of 115.685 and 116.353 tested. Both of these levels are previous highs.
In December 2016, USD/JPY made a high at 118.665, which may also provide initial resistance should it be tested again.
A bullish triple moving average (TMA) formation requires the price to be above the short term simple moving average (SMA), the latter to be above the medium term SMA and the medium term SMA to be above the long term SMA. All SMAs also need to have a positive gradient.
The price has recently moved above the 10-day SMA, and all the conditions have been met, with the exception of the gradient of the 21-day SMA.
If the price closes above 115.00 for the next two days, the gradient of the 21-day SMA will turn positive, creating a bullish TMA formation.
On the downside, support could be at the previous lows and pivot points of 114.161, 113.483, 113.223, 113.142, 112.533, 112.079, 110.802, 109.113 and 108.723.

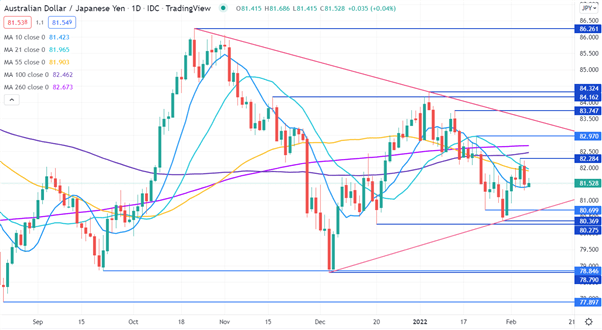
AUD/JPY – Technical Analysis
AUD/JPY has recently been consolidating around a number of different time frame simple moving averages (SMA). This could indicate a lack of directional momentum for the moment.
Resistance could be at the previous highs of 82.284, 82.970 and 83.747and 84.324. The longer term 100 and 260-day SMAs are currently sitting between the first 2 resistance levels and may also offer resistance.
Close by, the 21 and 55-day SMAs might offer resistance, currently at 81.965 and 81.903 respectively.
AUD/JPY bounced off the late January low of 80.369, which was just above the December low of 80.275. These levels are potential support as well as the pivot points of 80.699 and 78.846. The previous lows at 79.790 and 77.897 are also potential support.
Introduction to Technical Analysis
Moving Averages
Recommended by Daniel McCarthy
--- Written by Daniel McCarthy, Strategist for DailyFX.com
To contact Daniel, use the comments section below or @DanMcCathyFX on Twitter


