BTC/USD Technical Outlook:
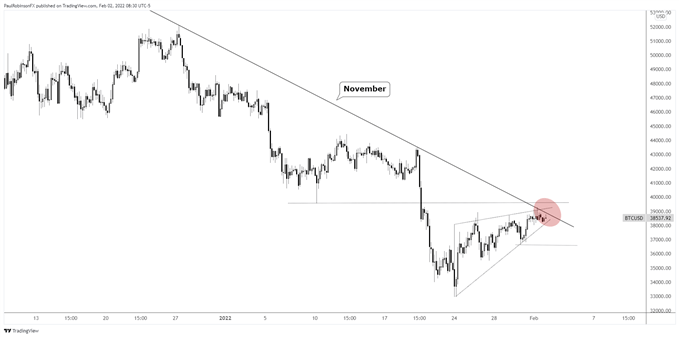
- Corrective wedge in the works as bounce unfolds
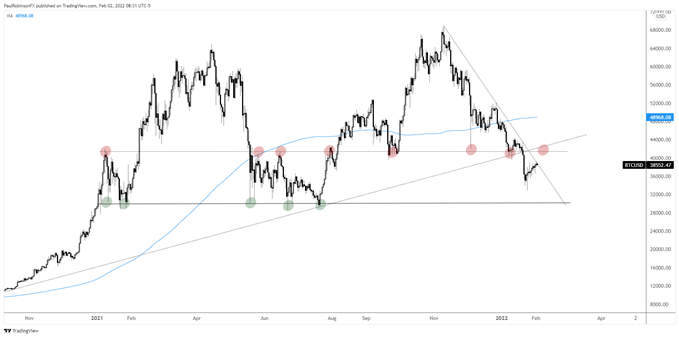
- Resistance via horizontal and trend-line in the vicinity
- Sub-30k holds the next area of major support


BTC/USD has recently found a bit of reprieve from selling, but that may be short-lived as the rise looks corrective in nature and resistance stands in the way. If the timing of the these events is to hold, we could see a downturn develop in the next few days.
The bounce from around 33k is taking on the shape of an ascending wedge, which in the context of a strong trend is viewed as corrective price action. Adding to the bearish case is resistance in near confluence.
The trend-line running down from the November high is currently getting tested while the low from Jan 10 at 39558 was nearly tagged over the last 24 hours. If these levels are to prove problematic, then today or tomorrow could kick off another round of selling.
To trigger the corrective pattern and form a lower-low off the Jan 24, a break below 36631 is needed. This will break the recent sequence of higher highs and higher lows that make up the corrective formation.
The first meaningful level of support is the recent low at 32950, but the really big stuff doesn’t arrive until under 30k. From around that level down to 28600 are several important lows dating to early last year. We will have to see how price action looks at that juncture, should we see it, but that could help provide a more meaningful low. Or not.
From a tactical standpoint, waiting for the wedge to break down below 36631 before increasing a bearish bias. It is possible we see the wedge force a squeeze above the noted resistance levels, but if this is the case then BTC/USD will find itself around major resistance surrounding 40k and that may then put in a ceiling within the context of a downtrend.
If we see the drop to the big support dating to early last year, then those looking to look to play for a sharp bounce may find risk/reward appealing, and backing off a bearish bias then may be warranted.
BTC/USD Daily Chart

BTC/USD 4-hr Chart

Resources for Forex Traders
Whether you are a new or experienced trader, we have several resources available to help you; indicator for tracking trader sentiment, quarterly trading forecasts, analytical and educational webinars held daily, trading guides to help you improve trading performance, and one specifically for those who are new to forex.
---Written by Paul Robinson, Market Analyst
You can follow Paul on Twitter at @PaulRobinsonFX


