


Euro, EUR/USD, IGCS – Technical Outlook
- Euro wrapped up a disappointing January, will downtrend resume?
- EUR/USD is eyeing a bullish Morning Star after a strong Monday
- 4-hour chart shows prices are at a key near-term falling trendline

Euro Technical Analysis
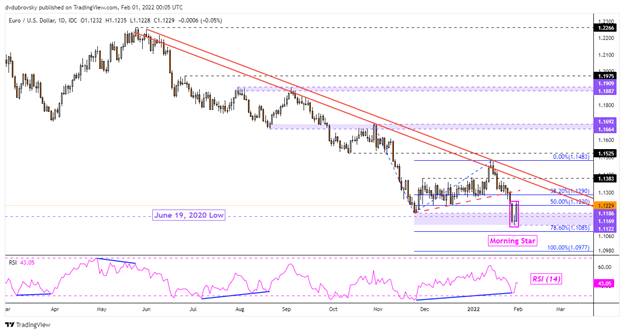
Following aggressive losses since the middle of January, is the Euro getting ready for a comeback against the US Dollar? The pair’s decline took out a near-term rising trendline from the end of November. Prices even closed under the June 19, 2020 low. However, follow-through was lacking as the pair left behind a wide range of support. The latter appears to be a zone between 1.1122 and 1.1186.
Moreover, EUR/USD left behind a bullish Morning Star candlestick formation. Confirmation is lacking at this point. A further upside close could open the door to extending gains. Keep in mind that a falling trendline from May seems to be maintaining the dominant downside focus. Immediate resistance appears to be the 38.2% Fibonacci extension at 1.1290 followed by the 1.1383 inflection point.
EUR/USD Daily Chart
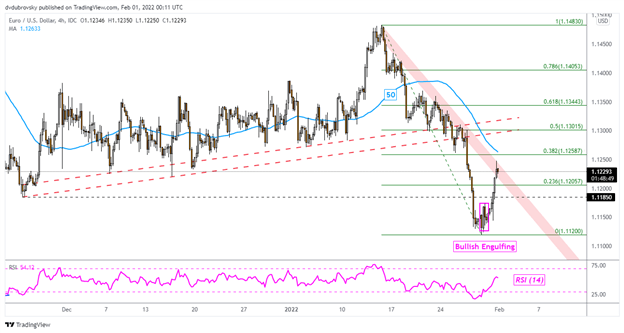
Zooming in on the 4-hour chart reveals that EUR/USD is facing a falling zone of resistance from the January peak. Recent gains followed the emergence of a Bullish Engulfing candlestick pattern. Piercing the trendline could open the door to extending gains in the near term. That would expose the 50-period Simple Moving Average for potential resistance above. Beyond the latter sits the former rising trendline from November, which may reinstate itself as new resistance. Turning lower opens the door for a retest of the January low at 1.1120.
4-Hour Chart
Euro Sentiment - Mixed
According to data from IG Client Sentiment (IGCS), about 65% of EUR/USD traders are net-long. IGCS can at times behave as a contrarian indicator. Since the majority of traders are long, this suggests prices may continue falling. However, upside exposure fell by 4.9% compared to yesterday and rose by about the same from last week. The combination of overall and recent shifts in positioning are offering a mixed trading bias.

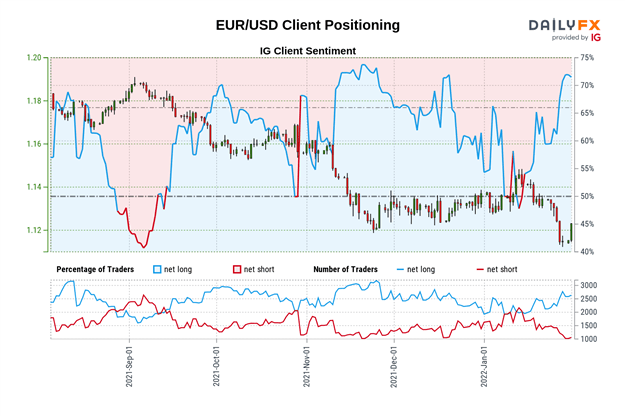
IGCS data used from January 31st report
--- Written by Daniel Dubrovsky, Strategist for DailyFX.com
To contact Daniel, use the comments section below or @ddubrovskyFX on Twitter
Trade Smarter - Sign up for the DailyFX Newsletter
Receive timely and compelling market commentary from the DailyFX team


