


Bitcoin, BTC/USD Talking Points:
- Bitcoin has had a slow start to the year but the major waypoints of 69k resistance at 42k support remain in-play.
- On a shorter-term basis, BTC/USD has shown multiple support tests around 45,666, with bulls showing a diminishing marginal response to that level. This sets up a descending triangle patter, often approached with the aim of bearish breakdowns, and that can possibly bring the 42k support level back into play.
- The analysis contained in article relies on price action and chart formations. To learn more about price action or chart patterns, check out our DailyFX Education section.

Bitcoin prices continue to hold support above the 42k print that came into play in early-December. This was a weekend move that created a shockwave on Saturday morning in the U.S. Since then, however, Bitcoin hasn’t been able to hold above the 52k level and prices have started to build a pattern of repeated support around the 45,666 level that’s now been in-play multiple times over the past few weeks.
The complication on the long side is the diminishing marginal response that’s showing from that support. Ahead of the Christmas holiday this support led to a bump back up to that 52k level. But after price action quickly retreated back to support, the bounces have grown more and more shallow, indicating that bulls are losing steam and may soon be unable to defend support. The formation showing at the moment is a descending triangle, and will often be approached with the aim of bearish breakdowns.
Bitcoin (BTC/USD) Four-Hour Price Chart

Chart prepared by James Stanley; Bitcoin on Tradingview
BTC/USD Bigger Picture
Taking a step back on the chart and the more operative question is whether a short-term breakdown can bring on another test of the 42k level.
This price of 42,000 was the 2020 swing high, set in December just before Bitcoin launched higher in Q1 of last year. That price came back into play albeit briefly when prices spilled lower last-month, but it was a quick hit so there remains the question of how many sitting orders might be at that line-in-the-sand.
Whether 42k holds or breaks upon its next test is complete guesswork given the dearth of recent historical examples there. But, its an inflection point and should be treated as such, if sellers start to make headway upon that next test then the door can quickly open to deeper breakdown potential. But, this level should not be taken lightly as its last test led into a 25% jump in a short period of time.
BTC/USD Daily Price Chart
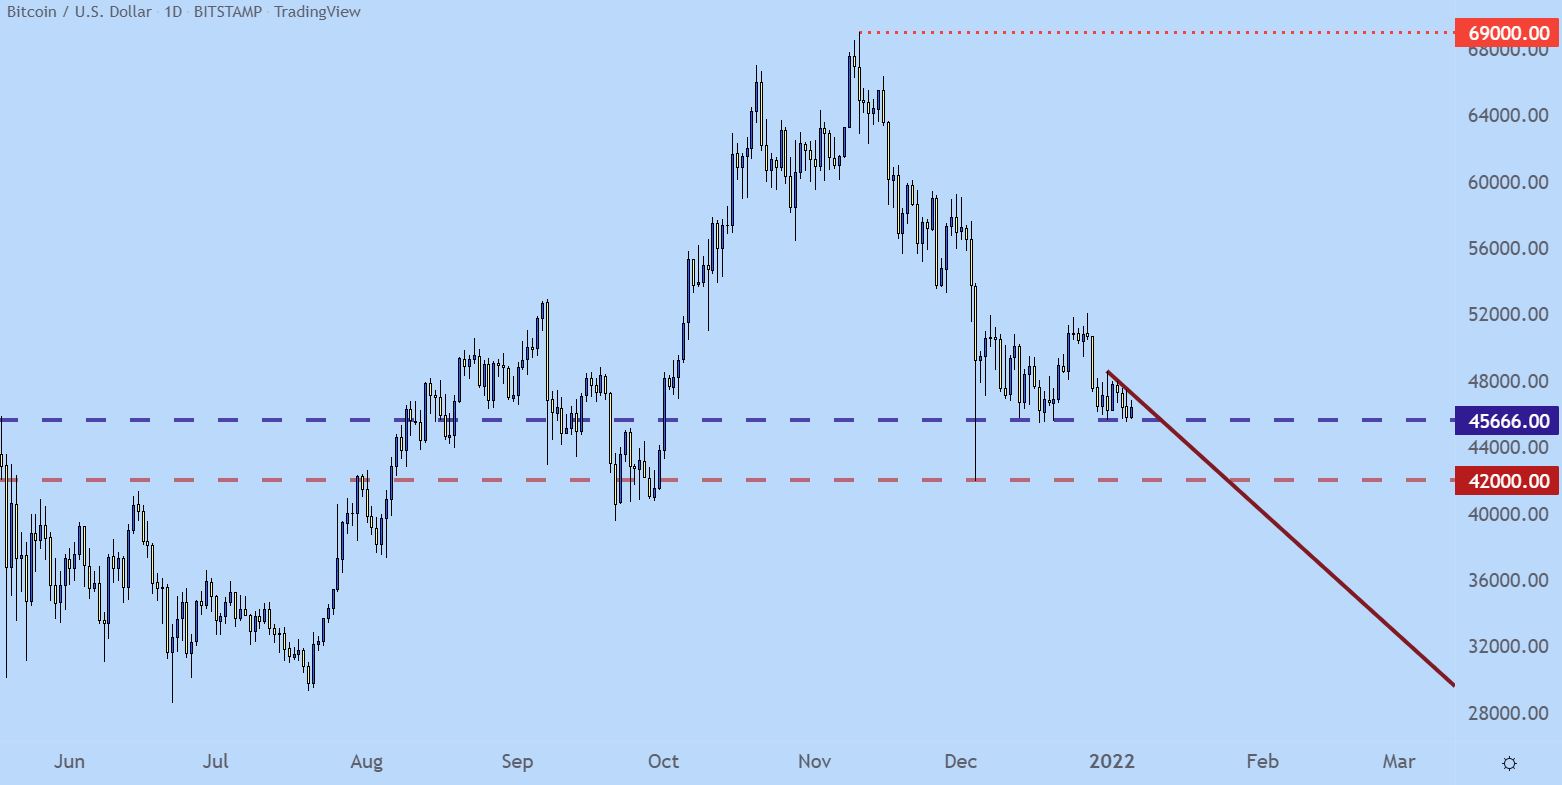
Chart prepared by James Stanley; Bitcoin on Tradingview
--- Written by James Stanley, Senior Strategist for DailyFX.com
Contact and follow James on Twitter: @JStanleyFX


