


US Dollar, USD/SGD, USD/THB, USD/IDR, USD/PHP – ASEAN Technical Analysis
- US Dollar has retreated against ASEAN FX, but losses have been cautious
- USD/SGD and USD/THB broader uptrends are still in play for time being
- USD/IDR remains within Rising Wedge, USD/PHP breakout looming?

Singapore Dollar Technical Outlook
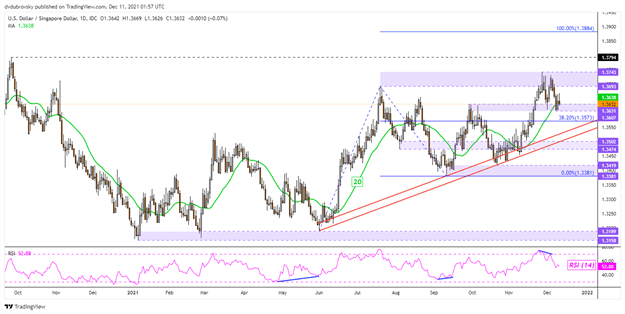
The US Dollar retreated cautiously against the Singapore Dollar this past week after USD/SGD rejected the key 1.3743 – 1.3693 resistance zone. This also followed negative RSI divergence, which showed that upside momentum was fading. Still, the broader uptrend since June remains intact, outlined via a rising trendline from then below. Immediate support seems to be the 1.3607 – 1.3631 support zone, where a breakout lower exposes the trendline. Resuming the uptrend entails clearing resistance towards 1.3794, which is the September 2020 high.
USD/SGD Daily Chart
Thai Baht Technical Outlook
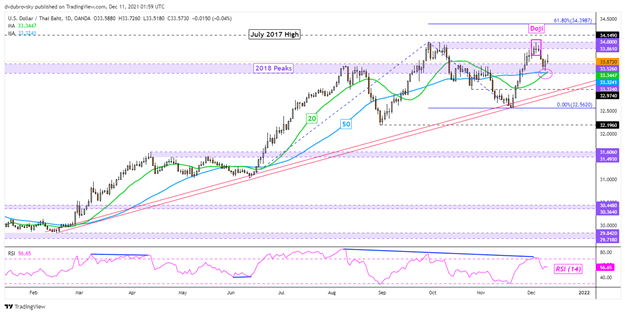
The US Dollar has also been on the back foot against the Thai Baht. USD/THB turned lower last week after failing to clear the key 34.000 – 33.861 resistance zone. This left the pair testing the 33.324 – 33.526 inflection zone, which has its beginnings from peaks in 2018. A bullish crossover recently occurred between the 20- and 50-day Simple Moving Averages (SMAs), offering an upward technical bias. Moreover, a rising trendline from February is still in play. Resuming the uptrend entails clearing resistance, exposing the July 2017 high at 34.149.

USD/THB Daily Chart
Indonesian Rupiah Technical Outlook
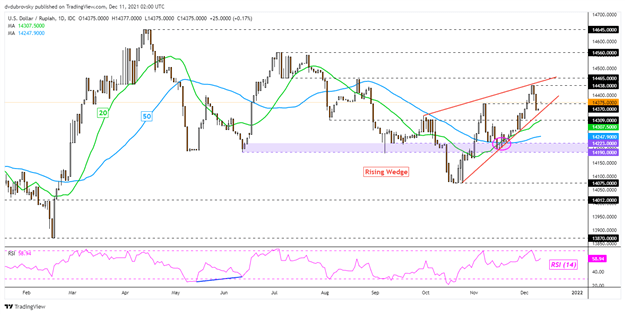
The US Dollar also lost some ground to the Indonesian Rupiah as of late, but USD/IDR remains trading within the boundaries of a bearish Rising Wedge chart formation. Prices may remain tilted upward within the wedge, but a breakout under it could open the door to resuming the June – October downtrend. Still, a bullish crossover between the 20- and 50-period SMAs remains in play, and these lines will come quickly into focus in the event of a wedge breakout lower. Extending the uptrend since October could see prices face the 14465 inflection point.
USD/IDR Daily Chart
Philippine Peso Technical Outlook
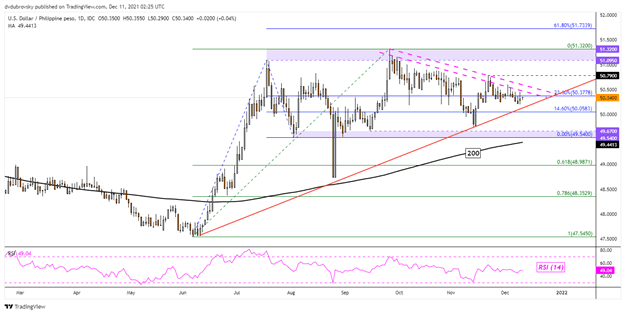
The US Dollar continues to range against the Philippine Peso, but USD/PHP may be running out of room to consolidate. The pair is now closely wedged between a rising trendline from June, and a falling zone of resistance from September. Clearing rising support and the 14.6% minor Fibonacci extension at 50.0583 exposes the 49.54 – 49.67 support zone. On the flipside, clearing falling resistance exposes the November peak at 50.79 towards the critical 51.32 – 51.09 resistance zone.
USD/PHP Daily Chart
--- Written by Daniel Dubrovsky, Strategist for DailyFX.com
To contact Daniel, use the comments section below or @ddubrovskyFX on Twitter
Trade Smarter - Sign up for the DailyFX Newsletter
Receive timely and compelling market commentary from the DailyFX team


