


British Pound, GBP/USD - Talking Points
- GBP/USD has consistently been moving lower as the US Dollar rallied
- The Pound has seen decreasing volatility as it wanders into a malaise
- Will Sterling continue to be undermined and make fresh lows again?

GBP/USD TECHNICAL ANALYSIS
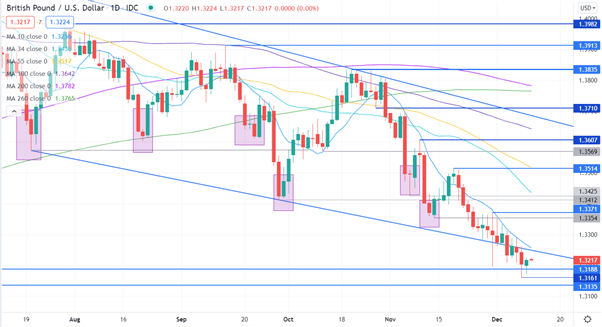
GBP/USD breached below a descending trend line last week. It has been trending lower since it made a high in May at 1.4250.
A bearish triple moving average (TMA) formation requires the price to be below the short term simple moving average (SMA), the latter to be below the medium term SMA and the medium term SMA to be below the long term SMA. All SMAs also need to have a negative gradient.
Looking at the 10, 21, 34, 55, 100, 260-day SMAs, they are all in sequence to meet the criteria for a TMA and all have a negative gradient, with the possible exception of the 260-day SMA.
The last three readings for the 260-day are at 1.3765. However, the value prior to that was 1.3766 which indicates that the SMA does have a negative slope. Another price input below 1.3300 would confirm the negative scope for the 260-day SMA.
With this in mind, any three SMAs illustrated here would meet the criteria for bearish TMA formation.
The lows from December 2020 could provide support at 1.3188 and 1.3135. The former was breached briefly but there was no follow through.
On the topside, the previous highs of 1.3371, 1.3514 and 1.3607 may offer resistance.
Introduction to Technical Analysis
Moving Averages
Recommended by Daniel McCarthy
GBP/USD BOLLINGER BAND TECHNICAL ANALYSIS
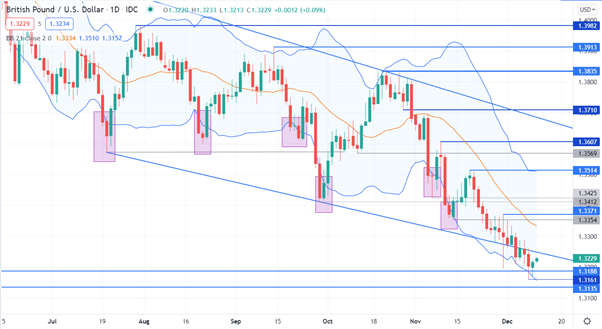
Recently, the price has been edging lower but has failed to close below the lower band of the 21-day simple moving average (SMA) based Bollinger Band. This might indicate that the market is accommodative of the move for now as volatility is reducing at a time when new lows are being made.
Previous episodes of GBP/USD having a close below the lower Bollinger Band and then a close back inside the band, have sometimes seen a pause in bearishness. This might be something that could counter bearish momentum should it unfold.
The lows from December 2020 could provide support at 1.3188 and 1.3135. The former was breached briefly but there was no follow through.
On the topside, previous highs of 1.3371, 1.3514 and 1.3607 may offer resistance.
--- Written by Daniel McCarthy, Strategist for DailyFX.com
To contact Daniel, use the comments section below or @DanMcCathyFX on Twitter


