


Japanese Yen, AUD/JPY, EUR/JPY, GBP/JPY, Technical Analysis, Retail Trader Positioning - Talking Points
- Retail traders increasingly bet that the Japanese Yen may fall
- Long exposure is rising in AUD/JPY, EUR/JPY and GBP/JPY
- Is the technical analysis lining up with the positioning signals?

According to IG Client Sentiment (IGCS), retail investors are increasingly betting that the Japanese Yen may weaken against the Australian Dollar, Euro and British Pound. Net-long exposure is increasing in AUD/JPY, EUR/JPY and GBP/JPY. IGCS can be a contrarian indicator. If this trend in positioning continues, then these pairs may fall instead.
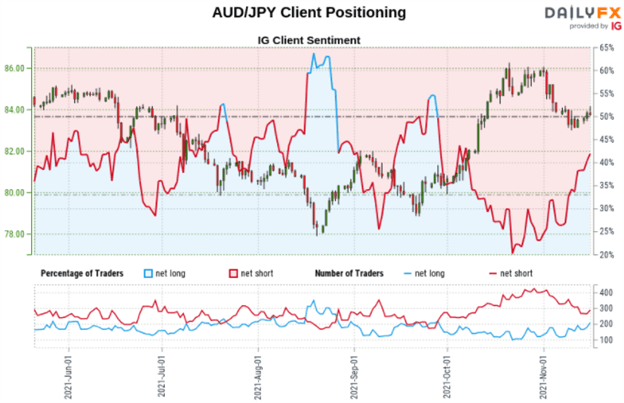
AUD/JPY Sentiment Outlook - Bearish
The IGCS gauge implies that roughly 42% of retail traders are net-long AUD/JPY. Upside exposure has increased by 6.6% and 32.08% respectively. Since most traders are still net-short, this suggests prices may rise. But, recent shifts in positioning are warning that the currency pair may reverse lower instead.

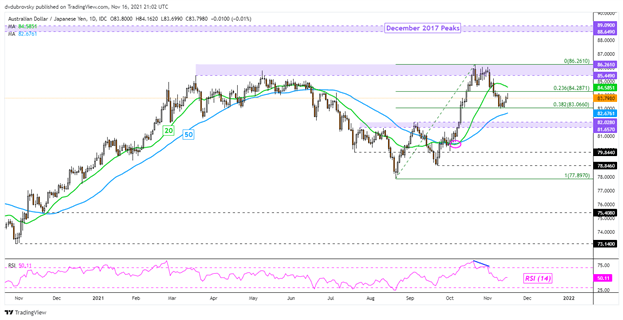
Technical Analysis
AUD/JPY remains in a near-term downtrend since the beginning of this month, where the pair rejected the critical 86.261 – 85.449 resistance zone. However, downside momentum has been slowing somewhat lately. This follows a pause on the 38.2% Fibonacci retracement at 83.066. Prices remain under the 20-day Simple Moving Average (SMA), but above the 50-day line. The latter may reinstate the dominant upside focus. Otherwise, the 82.028 – 81.657 inflection zone is in sight.
AUD/JPY Daily Chart
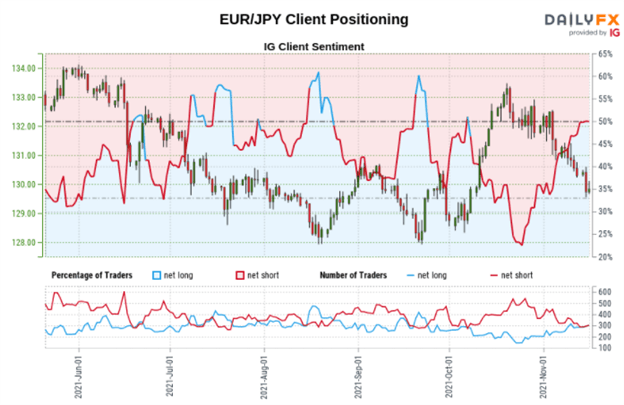
EUR/JPY Sentiment Outlook - Bearish
The IGCS gauge implies that about 51% of retail traders are now net-long EUR/JPY. Upside exposure has climbed by 7.41% and 3.57% over a daily and weekly basis respectively. Since the majority of investors are now biased higher, this suggests prices may continue falling. Recent shifts in positioning trends are further underscoring a bearish-contrarian trading bias.
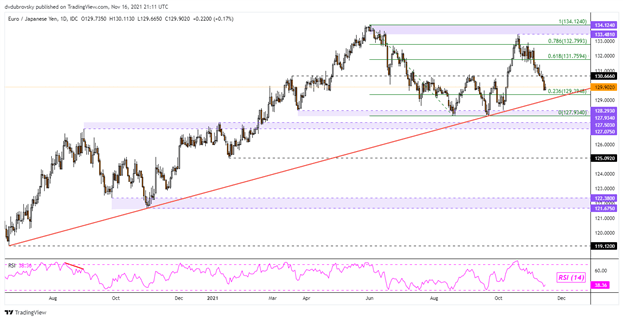
Technical Analysis
EUR/JPY continues its path lower since rejecting the 134.124 – 133.481 resistance zone. The pair is fast approaching what appears to be a long-term rising trendline from June 2020 – red line on the chart below. The 23.6% Fibonacci retracement level at 129.394 is also nearing. A combination of the trendline and Fibonacci could make for a critical area of support. Otherwise, breaking lower may see prices face the 127.934 – 128.293 support zone.
EUR/JPY Daily Chart
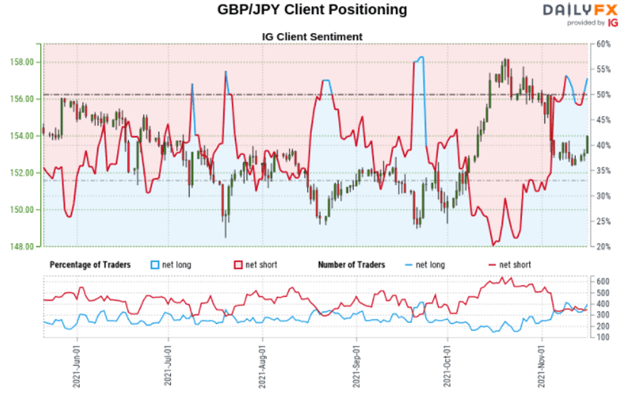
GBP/JPY Sentiment Outlook - Bearish
The IGCS gauge shows that roughly 56% of retail investors are net-long GBP/JPY. Upside exposure has increased by 11.68% and 9.18% over a daily and weekly basis respectively. This, plus the fact that most traders are net-long, offers a stronger bearish-contrarian trading bias.

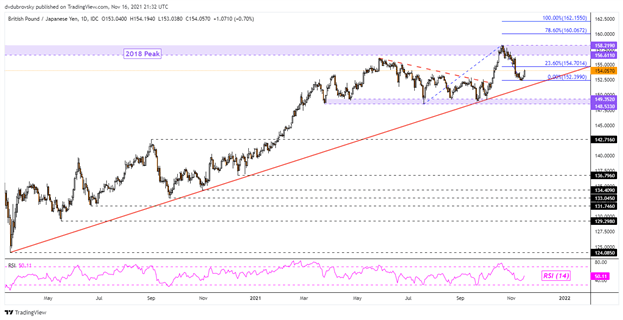
Technical Analysis
GBP/JPY remains in a near-term downtrend since October since prices rejected the 156.61 – 158.21 resistance zone. This range aligns closely with peaks from 2018. But, the broader technical bias remains tilted higher. A rising trendline from March 2020 seems to be guiding the pair upward. There is still room for prices to fall until reaching the trendline. Even breaking under the latter still leaves the 148.53 – 149.35 range to contend with. This is as the 4-hour chart hints at the potential for a turn higher.
GBP/JPY Daily Chart
*IG Client Sentiment Charts and Positioning Data Used from November 17th Report
--- Written by Daniel Dubrovsky, Strategist for DailyFX.com
To contact Daniel, use the comments section below or @ddubrovskyFX on Twitter


