


S&P 500, Dow Jones, Technical Analysis, Retail Trader Positioning - Talking Points
- Retail traders may be shifting into buying the S&P 500 and Dow Jones
- If this trend continues, Wall Street indices could be vulnerable ahead
- Watch key moving averages on the 4-hour charts for signs of reversal

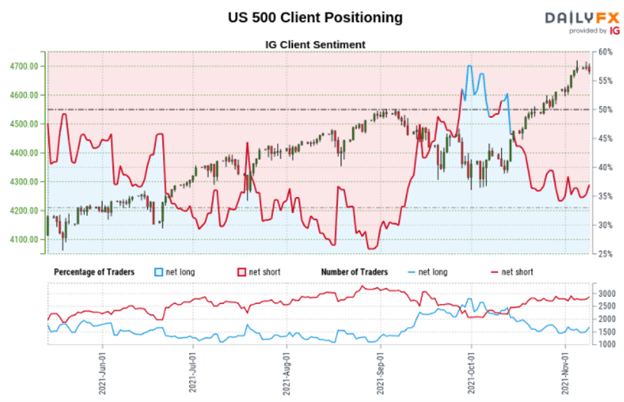
Taking a look at IG Client Sentiment (IGCS), retail traders continue to sell the major benchmark stock indices on Wall Street such as the S&P 500 and Dow Jones. But, recent shifts in positioning show that this trend could perhaps reverse next. IGCS can at times be a contrarian indicator. If investors shift into increasingly buying these indices, then their trend could reverse lower. To learn more about how can you use this tool in your own strategy, check out the recording of my webinar above.
S&P 500 Sentiment Outlook - Bearish
The IGCS gauge shows that about 37% of retail traders are net-long the S&P 500. Upside exposure has increased by 3.09% and 3.21% over a daily and weekly basis respectively. Since the majority of traders are still net-short, this suggests that prices may continue rising. However, recent shifts in positioning warn that the current price trend may reverse lower despite this.

Technical Analysis
Taking a look at the 4-hour chart, S&P 500 futures have started to exhibit early signs of a turn lower. Prices took out the near-term 20-period Simple Moving Average (SMA). Still, this leaves the 50- and 100-period lines intact, maintaining the broader upside focus. In the event of further losses, these may hold as key support. Otherwise, clearing them may open the door to extending losses towards lows from October. Otherwise, clearing 4711.75 exposes the 100% Fibonacci extension at 4780.25.
S&P 500 Futures 4-Hour Chart

Dow Jones Sentiment Outlook - Bearish
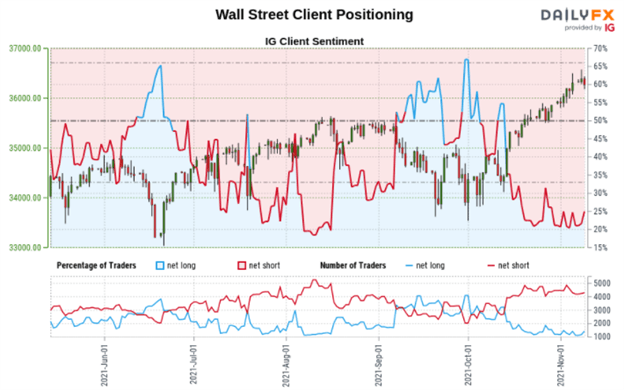
The IGCS gauge implies that about 31% of retail traders are net-long the Dow Jones. Upside exposure has increased by 28.46% and 36.24% over a daily and weekly basis respectively. Since most retail investors are still net-short, this suggests that the Dow may continue climbing. But, recent changes in sentiment warn that the current price trend may soon reverse lower despite this.
Technical Analysis
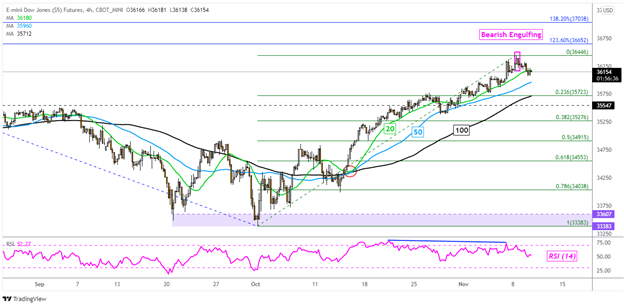
Dow Jones futures have confirmed a Bearish Engulfing candlestick pattern as the index pressures the 20-period SMA on the 4-hour chart. This also followed negative RSI divergence, which showed that upside momentum was fading. Taking out the 50- and 100-period lines could further open the door to extending losses towards the October low. Otherwise, clearing 36446 exposes the 123.6% Fibonacci extension at 36652 towards the 138.2% level at 37038.
Dow Jones Futures 4-Hour Chart
*IG Client Sentiment Charts and Positioning Data Used from November 10th Report
--- Written by Daniel Dubrovsky, Strategist for DailyFX.com
To contact Daniel, use the comments section below or @ddubrovskyFX on Twitter
Trade Smarter - Sign up for the DailyFX Newsletter
Receive timely and compelling market commentary from the DailyFX team


