


Australian Dollar, AUD/USD, AUD/JPY, Technical Analysis, Retail Trader Positioning - Talking Points
- Retail traders increasingly betting the Australian Dollar may rise
- AUD/USD, AUD/JPY bearish contrarian signals are now in focus
- Technical analysis shows they appear struggling around resistance

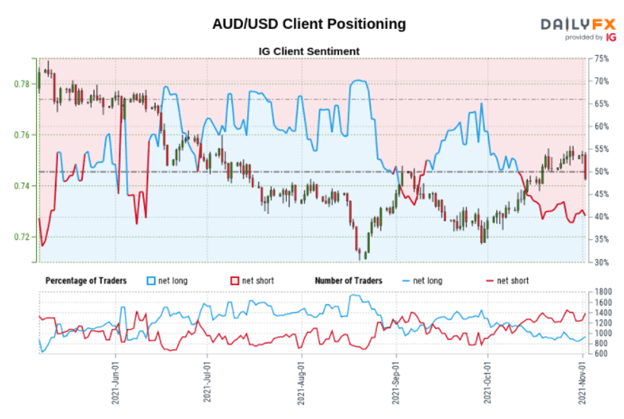
Taking a look at IG Client Sentiment (IGCS), retail traders appear to be increasingly betting that Australian Dollar may appreciate against the US Dollar and Japanese Yen. IGCS can at times be a contrarian indicator. If this trend in positioning continues, the Aussie could weaken instead. To learn more about using this tool in your own trading strategy, check out last week’s recording of my biweekly IGCS webinar. There I discussed the S&P 500 and Dow Jones.
AUD/USD Sentiment Outlook - Bearish
The IGCS gauge implies that roughly 48% of retail traders are net-long AUD/USD. Upside exposure increased by 16.86% and 6.98% compared to yesterday and last week respectively. Since the majority of investors are net-short, prices may continue rising. However, recent shifts in positioning warn that the current price trend may reverse lower.

Technical Analysis
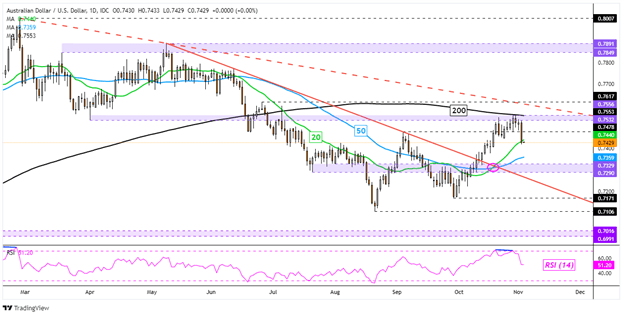
AUD/USD recently rejected the 0.7556 – 0.7532 inflection zone as negative RSI divergence emerged. The latter shows fading upside momentum, which can hint at a turn lower. Prices fell to the 20-day Simple Moving Average (SMA), closing under the September high of 0.7478 as the 200-day line acted as key resistance. A further downside close under the 20-day SMA may open the door to testing the 50-day line. A bullish Golden Cross between the short-term SMAs still remains in place. Clearing 0.7556 may open the door to extending gains since late August.
AUD/USD Daily Chart
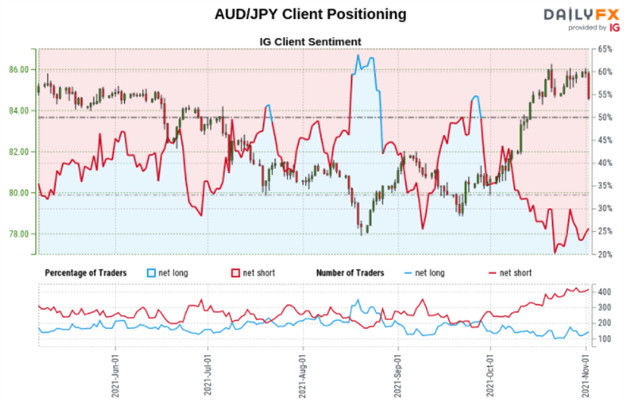
AUD/JPY Sentiment Outlook - Bearish
The IGCS gauge implies that roughly 29% of retail traders are net-long AUD/JPY. Upside exposure has increased by 14.29% and 9.59% compared to a daily and weekly basis respectively. Since the majority of retail traders are still net-short, prices may continue climbing. But, recent shifts in positioning are offering a bearish-contrarian trading bias.
Technical Analysis
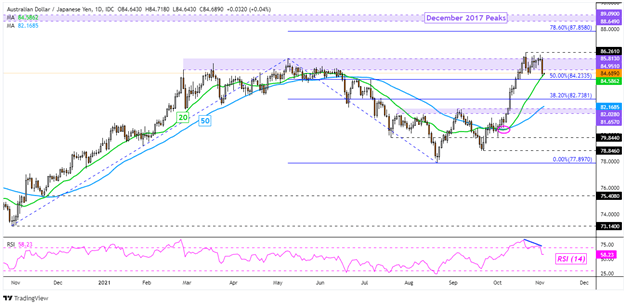
AUD/JPY has been struggling to break above the 85.813 – 84.951 resistance zone since prices rose aggressively to this range in October. Negative RSI divergence emerged, showing fading upside momentum. The decline on Tuesday has brought the pair to the 20-day SMA, holding as key support. A breakout under this line may open the door to extending losses to the 50-day SMA. The latter could reinstate the dominant upside focus. Extending gains above 86.261 may open the door to setting course for December 2017 peaks.
AUD/JPY Daily Chart
*IG Client Sentiment Charts and Positioning Data Used from November 3rd Report
--- Written by Daniel Dubrovsky, Strategist for DailyFX.com
To contact Daniel, use the comments section below or @ddubrovskyFX on Twitter
Trade Smarter - Sign up for the DailyFX Newsletter
Receive timely and compelling market commentary from the DailyFX team


