


Majors-Based Japanese Yen Index, USD/JPY, AUD/JPY – Technical Outlook
- Majors-based Japanese Yen index faces key support, broader downtrend holds
- This is translating into key immediate resistance levels for USD/JPY & AUD/JPY
- If prices struggle here, a turn lower would place focus on key moving averages

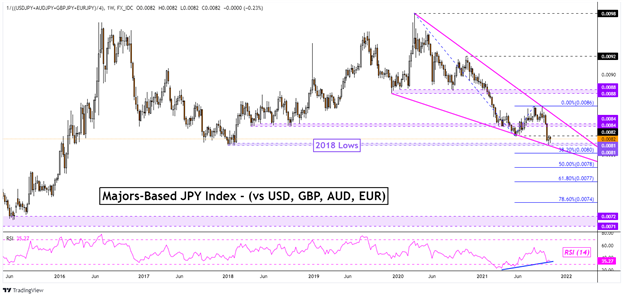
Taking a look at a majors-based Japanese Yen index on the weekly chart below, JPY appears to be facing key levels of support dating back to lows from 2018. While the index has seen its drop from late September pause, recent gains have been somewhat lackluster. This is leaving the Yen index lacking the confirmation to argue that a bounce is in the works.
With that in mind, the Yen’s performance this week could set course for the broader trend to come. JPY has been in a long-term downtrend since March 2020, consolidating within a bullish Falling Wedge chart formation. Positive RSI divergence continues to show that downside momentum is fading. That may precede a turn higher, placing the focus on the ceiling of the wedge. What can this mean for USD/JPY and AUD/JPY?
Majors-Based Japanese Yen Index Weekly Chart
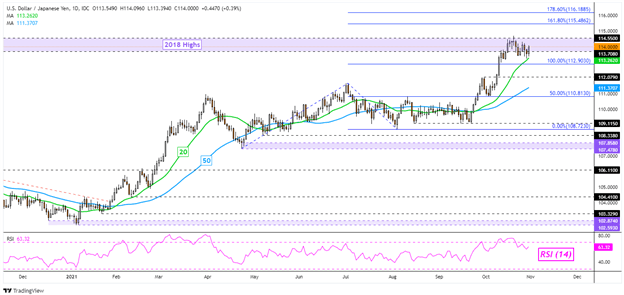
USD/JPY has been stalling around peaks from 2018, making for a critical zone of resistance between 114.55 and 113.70. Still, the 20- and 50-day Simple Moving Averages continue to point towards an upside technical bias. Clearing the former line may hint at near-term losses, placing the focus on the 100% Fibonacci extension level at 112.90.
Below that price, the 112.07 inflection point and 50-day SMA would come into play. The latter may reinstate the dominant upside focus. Resuming the uptrend entails clearing 2018 peaks. That exposes the 161.8% and 178.6% Fibonacci extension levels at 115.48 and 116.18 respectively. Keep a close eye on RSI though, negative divergence may persist if momentum struggles, undermining upside progress.

USD/JPY Daily Chart
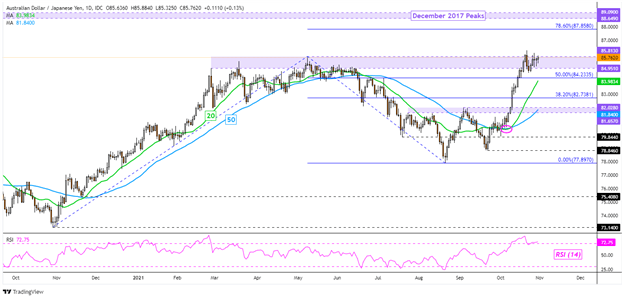
AUD/JPY has also been seeing recent gains stall. The pair is struggling around the 84.95 – 85.81 resistance zone, which is made up of peaks from February and April. A breakout higher, with confirmation, would expose the 78.6% Fibonacci extension at 87.85 towards peaks from December 2017. The latter makes for a range between 88.64 and 89.09.
Watch RSI, negative divergence could emerge in the event of a push higher. This could undermine upside progress. In the event of a turn lower, keep a close eye on the 20-day SMA. The latter could pivot prices back higher. Otherwise, a breakout under the line would expose the 50-day SMA. The latter is currently sitting around the 81.65 – 82.02 inflection zone.
| Change in | Longs | Shorts | OI |
| Daily | 9% | -8% | -3% |
| Weekly | 23% | -25% | -15% |
AUD/JPY Daily Chart
--- Written by Daniel Dubrovsky, Strategist for DailyFX.com
To contact Daniel, use the comments section below or @ddubrovskyFX on Twitter


