Bitcoin, Ethereum Talking Points:
- Bitcoin has continued its bounce and is now trading at a fresh four-month-high.
- With a number of Bitcoin ETFs vying for issuance and with George Soros rumored to be making a move into cryptocurrencies, there’s been extra motive behind BTC, of recent.
- Ethereum has remained relatively strong although its been unable to keep up with Bitcoin. Ethereum is highlighting a potential breakout as price action coils below a big spot of resistance.
- The analysis contained in article relies on price action and chart formations. To learn more about price action or chart patterns, check out our DailyFX Education section.


While Gold prices remain subdued amidst the recent USD breakout, cryptocurrencies continue to move with Bitcoin notching yet another four-month-high this morning. Ethereum remains a bit more subdued at the moment as the coin continues to coil below a very obvious spot of resistance; but as looked at a week ago, with Jerome Powell saying that the Fed had ‘no intention’ of banning cryptocurrencies, the door was wide open for bulls to make a mark.
Those comments from Powell were relevant last week but he was joined by Gary Gensler, the head of the SEC who said something very similar on Wednesday. That announcement seemed to wave the red flag in front of crypto bulls, with Bitcoin jumping back above the 50k marker on the heels of those comments.
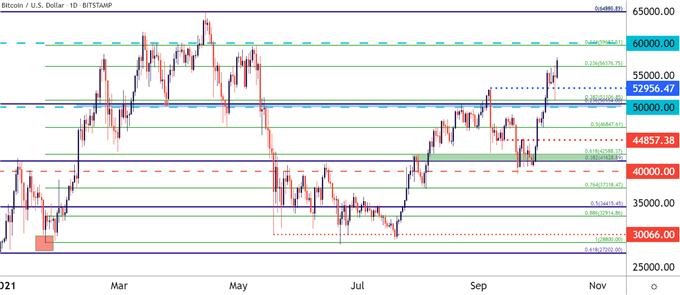
That trend has largely continued, with Bitcoin crossing another technical boundary this morning at 56,376, which is the 23.6% Fibonacci retracement of the 2021 major move. This level now becomes short-term higher-low support potential, with another level of interest around the 55k psychological level and another at the prior swing-high, around the 52,956 price.
On the resistance side of the equation, the big level that looms large above is the 60k psychological level, which Bitcoin did trade above back in March and April; but in both instances buyer support dried up very quickly before prices began to fall back below that key threshold.
To learn more about psychological levels, check out DailyFX Education
Bitcoin Daily Price Chart

Chart prepared by James Stanley; Bitcoin on Tradingview
Ethereum Coils Underneath Resistance
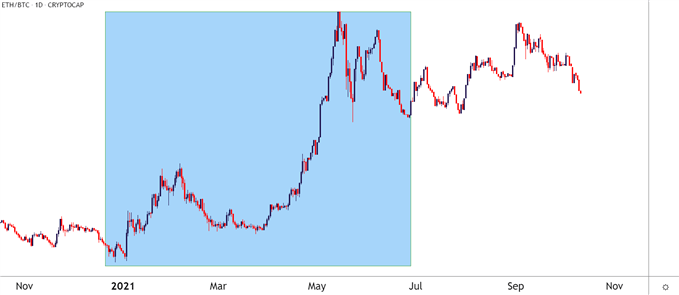
Ethereum was outperforming Bitcoin into early-September and with the craze in NFTs it’s pretty obvious why that was happening. But matters began to shift around mid-September with a hastening in that theme since the October open.
Could this, perhaps, be an indication that Bitcoin is being used as an inflation hedge while Ethereum’s use case is more relegated to cryptocurrency use cases, such as with NFTs? Regardless of what it is, that tide has started to turn as the below ETH/BTC chart shows.
Bitcoin v/s Ethereum Daily Chart

ETH/BTC on Tradingview; prepared by James Stanley
Ethereum Resistance
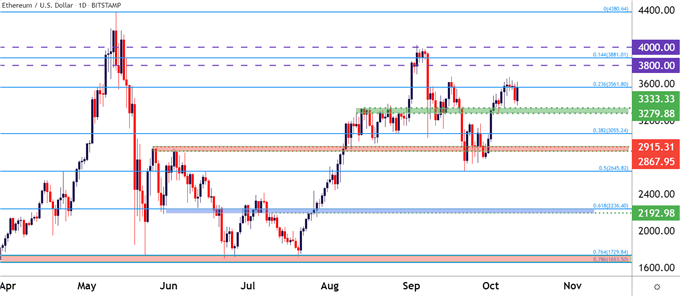
At this point, Ethereum continues to see price action coil below a big area of resistance. This is from the 23.6% Fibonacci retracement of the 2021 major move and this same price had helped to cap the advance in the latter portion of last week and through the weekend. Support has held above the key zone taken from prior resistance, plotted from around 3279-3333.33. This keeps the door open for bullish breakout potential, and the next spot of resistance ahead appears around the 3800 level, after which a Fibonacci level exists at 1881 and then there’s the psychological level at 4000.
ETH/USD Daily Price Chart

Chart prepared by James Stanley; Ethereum on Tradingview
--- Written by James Stanley, Senior Strategist for DailyFX.com
Contact and follow James on Twitter: @JStanleyFX


