


S&P 500, Dow Jones, DAX 30, Technical Analysis, Retail Trader Positioning - Talking Points
- Retail investors continue increasing bullish bets in S&P 500, Dow Jones, DAX 30
- This is depicted via IG Client Sentiment, which is usually a contrarian indicator
- Check out this week’s webinar recording for a deeper look into how this tool works

Taking a look at IG Client Sentiment (IGCS), retail traders appear to be increasing upside exposures in major benchmark stock indices such as the S&P 500, Dow Jones and DAX 30. IGCS is typically a contrarian indicator, especially in trending markets. This implies that if investors continue buying into recent price action, then there may be room for further weakness ahead. To learn more about using this tool in your own trading strategy, check out the recording of this week’s webinar that I hosted.
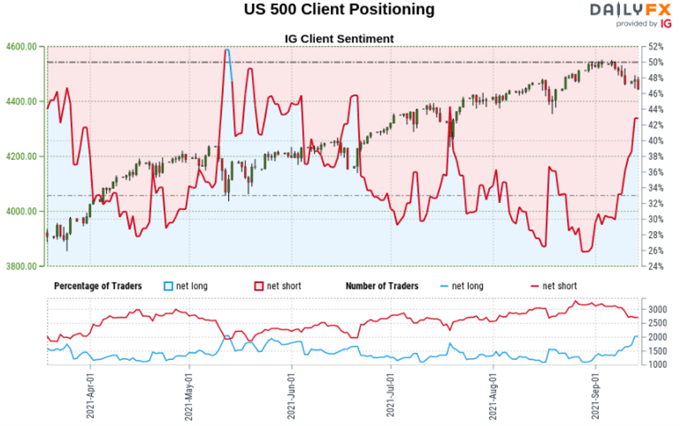
S&P 500 Sentiment Outlook - Bearish
The IGCS gauge implies that roughly 46% of retail traders are net-long the S&P 500. Upside exposure has increased by 10.88% and 31.80% over a daily and weekly basis respectively. We typically take a contrarian view to crowd sentiment. Since most traders are still net-short, this suggests that prices may keep rising. However, the recent shifts in positioning are tilting the S&P 500 outlook to the downside.

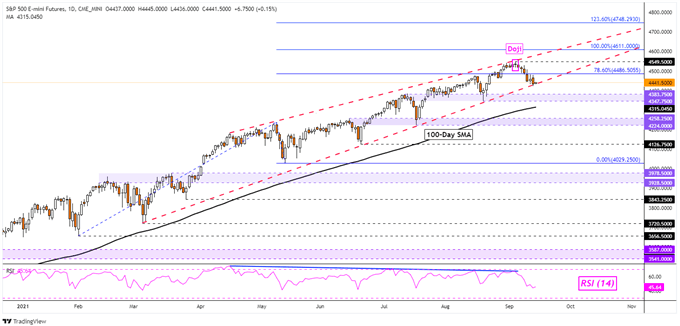
Technical Analysis
S&P 500 futures declined to test the floor of what appears to be a bearish Rising Wedge chart pattern that has its roots in March. A bounce from here that could send the index back towards the wedge ceiling, resuming the broader uptrend. On the other hand, a daily close under the wedge floor may open the door to testing the 100-day Simple Moving Average. Keep a close eye on the key 4347 – 4383 inflection zone.
S&P 500 Futures Daily Chart
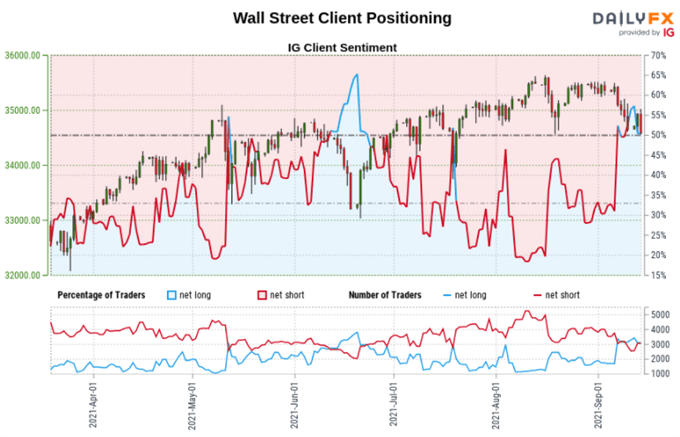
Dow Jones Sentiment Outlook - Bearish
The IGCS gauge implies that about 58% of retail traders are net-long the Dow Jones Industrial Average. Upside exposure has increased by 17.64% and 9.25% over a daily and weekly basis, respectively. That most traders are now net-long hints that prices may continue falling. The recent adjustments in retail trader positioning underscore the downside bias further.
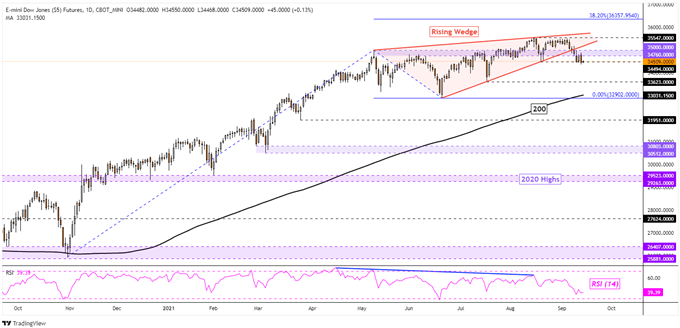
Technical Analysis
Dow Jones futures look increasingly vulnerable to a material turn lower after prices broke under a bearish Rising Wedge chart formation. A daily close under immediate support at 34494 would expose the July low at 33623 as the 200-day SMA slowly creeps closer. The latter could reinstate the dominant focus to the upside, but getting to the line entails a drop in excess of 4%. Resuming the uptrend would place the focus on resistance at 35547, the current all-time high.
Dow Jones Futures Daily Chart
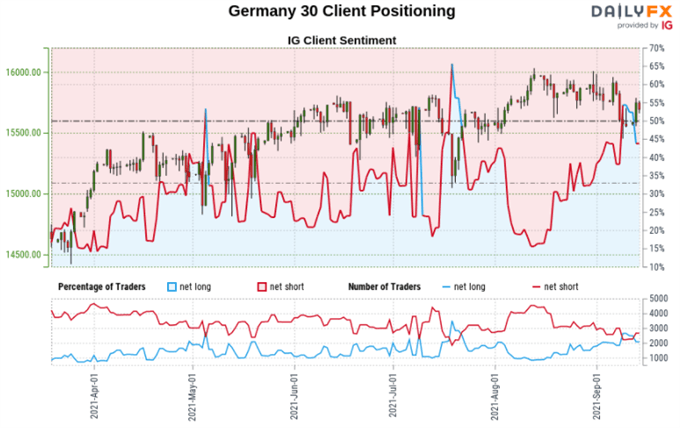
DAX 30 Sentiment Outlook - Bearish
The IGCS gauge implies that about 43% of retail traders are net-long the DAX 30. Upside exposure has increased by 1.68% and 11.51% over a daily and weekly basis respectively. Since the majority of traders are still net-short, IGCS suggests that prices may rise. However, the recent shifts in retail trader positioning warn that prices may reverse lower.

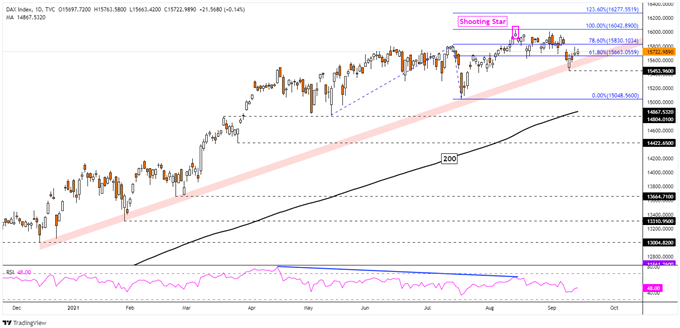
Technical Analysis
The DAX 30 has remained in broad consolidation since June. However, rising support from December 2020 seems to be guiding the index to the upside. That said, prices are once again sitting on the cusp of the trendline. A bounce from here could see the DAX revisit the August all-time high just shy of 16042. Otherwise, breaking under rising support exposes the 200-day SMA, which may reinstate the focus to the upside down the road.
DAX 30 Daily Chart
*IG Client Sentiment Charts and Positioning Data Used from September 14th Report
--- Written by Daniel Dubrovsky, Strategist for DailyFX.com
To contact Daniel, use the comments section below or @ddubrovskyFX on Twitter


