Bitcoin (BTC/USD), Ethereum (ETH/USD), Cardano (ADA/USD) Talking Points:
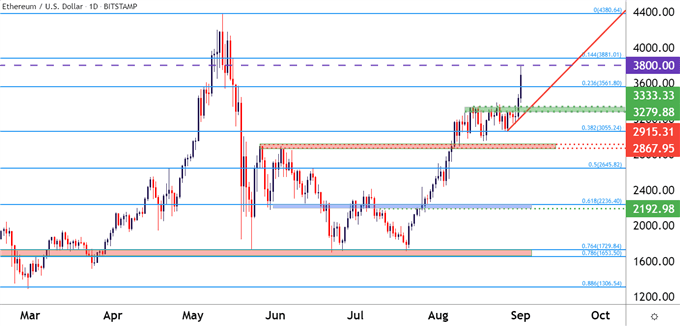
- Ethereum broke out to a fresh three-month-high this morning.
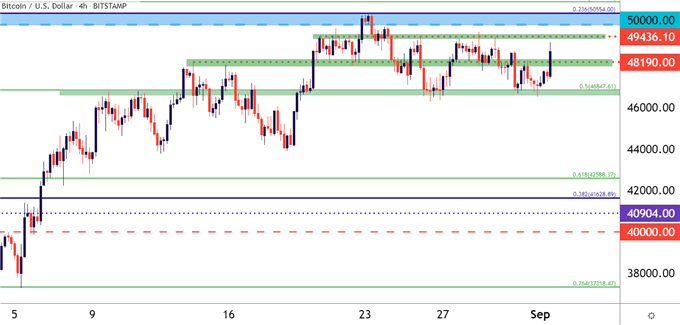
- Bitcoin bounced from a big spot of Fibonacci support looked at yesterday.
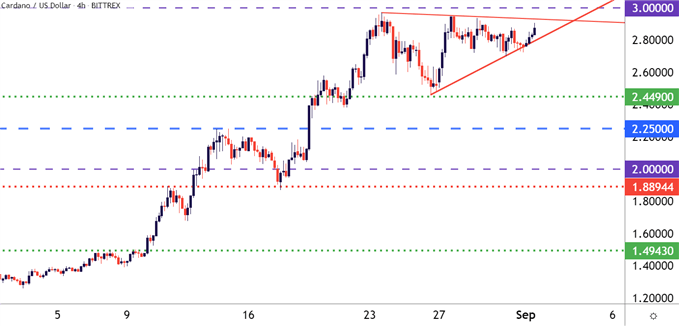
- Cardano continues to coil, retaining breakout potential under the 3.0000 handle.
- The analysis contained in article relies on price action and chart formations. To learn more about price action or chart patterns, check out our DailyFX Education section.
Crypto markets continue to run, and today the big move is showing in Ethereum as the coin has broken out to another fresh three-month-high. I had looked into the matter yesterday, and at the time Ethereum had just pulled back for a test of support at prior resistance after another more mild breakout. But, as many have learned around cryptocurrency markets, things can shift very fast and prices haven’t really settled much since that support test.
This morning brought another fresh three-month-high into Ethereum with prices moving very near the 3800 level. The past hour has seen the move beginning to pull back, and this can allow for a re-assignment of prior resistance as future support potential. The level around 3561 is the 23.6% Fibonacci retracement of the Jan 11 – May major move, and this is a set of levels that’s elicited a number of support/resistance inflections over the past couple of months. If that level cannot hold as support, the same zone from yesterday comes back into play, and that plots from 3279-3333.
To learn more about Fibonacci, check out DailyFX Education
Ethereum (ETH/USD) Daily Price Chart

Chart prepared by James Stanley; Ethereum on Tradingview
Bitcoin Bounces From Support
Also in yesterday’s crypto piece I took a look at a big spot of support in Bitcoin. Bulls have since responded to that level, pushing back-up for a test of the 49k level.
At this point, Bitcoin price action still has the appearance of mean reversion, even with this morning’s support bounce, and for those looking for trending crypto markets, there may be more amenable avenues elsewhere, for now.
On Bitcoin, a couple of big levels are ahead: At 49,436 is another point of short-term resistance but that leads into the 50k psychological level which has proven to be a tough spot on the chart for Bitcoin. Around that 50k psychological level is also a Fibonacci level, plotted at around 50,554 which currently also marks the three-month-high.
To learn more about psychological levels or Fibonacci, check out DailyFX Education
Bitcoin Four-Hour Price Chart

Chart prepared by James Stanley; Bitcoin on Tradingview
Cardano Wedges into Bull Pennant
On the alt-coin front, Cardano continues to posture just below the 3.0000 big figure, and the item of excitement here is the recent craze in NFTs. Non-fungible tokens helped Solana to put in a massive move over a week and given the recent announcement from the creators of Cardano, it would seem that similar potential may exist there as well, as Cardano will soon be equipped to also carry smart contracts which can allow for the usage of NFTs.
On that news in August the coin caught a strong bid to rally up to a fresh all-time-high. Over the past week, the attention appeared to move over to Solana as those NFT offerings were catching so much attention, and Cardano has been coiling into a symmetrical wedge pattern as that’s been going on. But, if that wedge is matched with the prior trend, that makes for a bull pennant formation, which may allow for a trader to move towards that congestion with some element of near-term bias.
To learn more about symmetrical wedges or bull pennants, check out DailyFX Education
Cardano Four-Hour Price Chart

Chart prepared by James Stanley; Cardano on Tradingview
--- Written by James Stanley, Senior Strategist for DailyFX.com
Contact and follow James on Twitter: @JStanleyFX


