


Dow Jones, S&P 500, Technical Analysis, Retail Trader Positioning - Talking Points
- Retail investors continue to heavily short US major benchmark stock indices
- Rising Dow Jones and S&P 500 short bets offer bullish contrarian trade bias
- Looking at technical analysis seems to point to a different conclusion however

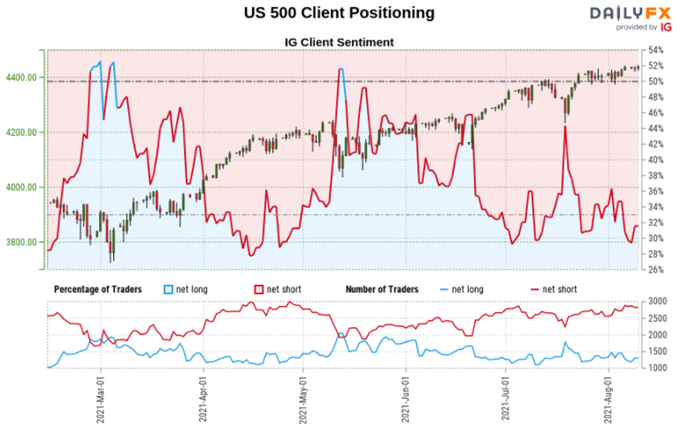
According to IG Client Sentiment (IGCS), retail investors continue to aggressively short US benchmark stock indices such as the Dow Jones and S&P 500. IGCS is usually a contrarian indicator, especially in a trending market. If traders continue selling into recent price action seen on Wall Street, then there may be room for further upside potential in equities. For a detailed analysis about how you can use IGCS in your own trading strategy, check out last week’s recording to my biweekly webinar about the tool.
Dow Jones Sentiment Outlook - Bullish
The IGCS gauge implies that about 20% of retail investors are net-long the Dow Jones. Downside exposure has increased by 14.81% and 20.63% over a daily and weekly basis respectively. The fact that traders are net-short hints prices may continue rising. The combination of this and recent shifts in sentiment offers a stronger bullish contrarian trading bias.


Technical Analysis
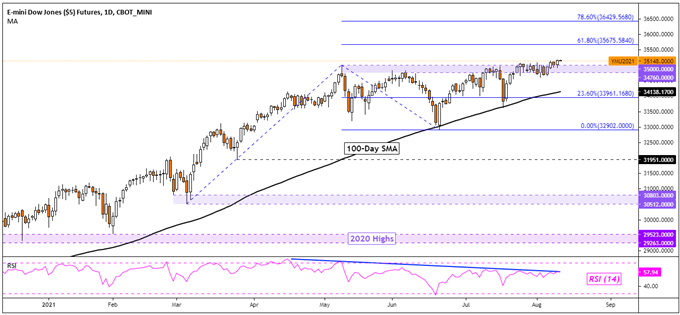
Dow Jones futures have climbed to record highs as of late, pushing above the 34760 – 35000 resistance zone after months of consolidation. Still, negative RSI divergence shows that upside momentum is fading. That can at times precede a turn lower. Such an outcome could place the focus on the 100-day SMA, which may reinstate the dominant focus to the upside.
Dow Jones Futures Daily Chart
S&P 500 Sentiment Outlook - Bullish
The IGCS gauge implies that 31% of retail investors are net-long the S&P 500. Upside exposure has increased by 1.62% and 9.07% over a daily and weekly basis respectively. The fact that traders are net-short hints that prices may continue rising. The combination of this and recent changes in sentiment are offering a stronger bullish-contrarian trading bias.

Technical Analysis
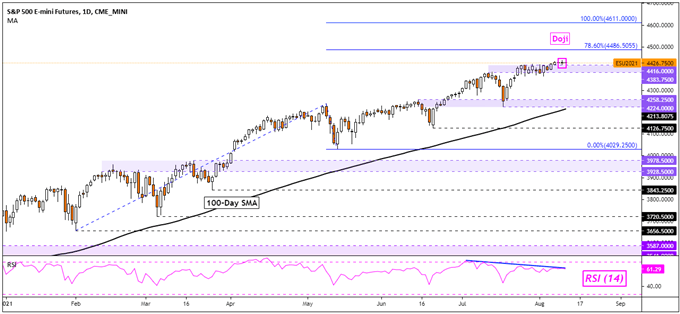
S&P 500 futures are slowing making progress above the 4383 – 4416 resistance zone, but the pace has been quite slow. A Doji candlestick pattern has appeared, which is a sign of indecision. A downside close following the Doji could hint at further losses to come. Negative RSI divergence is also persisting. Keep a close eye on the 100-day SMA in the event of a material turn lower, the line may reinstate the focus to the upside.
S&P 500 Futures Daily Chart
*IG Client Sentiment Charts and Positioning Data Used from August 11th Report
--- Written by Daniel Dubrovsky, Strategist for DailyFX.com
To contact Daniel, use the comments section below or @ddubrovskyFX on Twitter


