


S&P 500, DAX 30, FTSE 100, Technical Analysis, Retail Trader Positioning - Talking Points
- Global stock markets fell on Tuesday, retail traders were quick to act
- Rising long bets in the S&P 500, DAX 30 and FTSE 100 offer warning
- Check out last week’s webinar recording to learn about retail positioning

Risk aversion struck financial markets over the past 24 hours, sending global stock markets lower. On Wall Street, the S&P 500 declined. Germany’s DAX 30 also weakened while the FTSE 100 dropped on the London Stock Exchange.
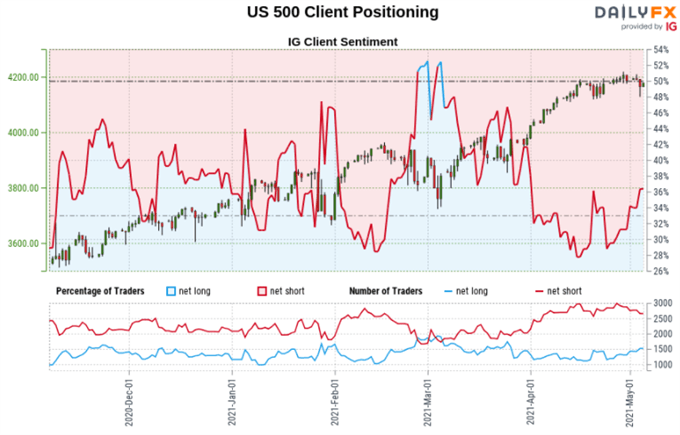
Retail traders were quick to act, taking up long positions in these markets, according to IG Client Sentiment (IGCS). IGCS is typically a contrarian indicator. For more analysis on this tool, check out last week’s webinar recording where I discussed how you can use IGCS in a trading strategy.
S&P 500 Sentiment Outlook - Bearish
The IGCS gauge implies that about 38% of retail investors are net long the S&P 500. Upside exposure climbed by 8.81% and 16.63% over a daily and weekly basis respectively. Recent changes in sentiment warn that the current price trend may soon reverse lower despite the fact traders remain netshort.
Technical Analysis
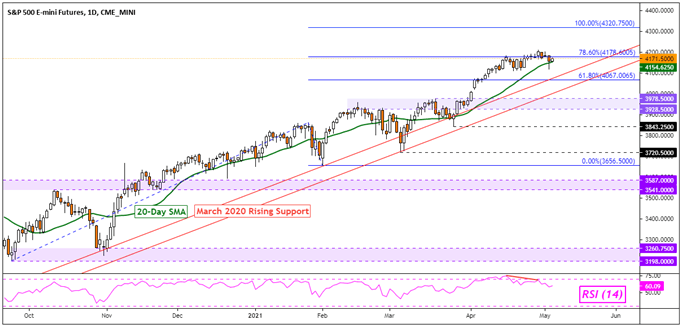
From a technical standpoint, the S&P 500 was already showing a sign of weakness in the form of negative RSI divergence. This highlighted that upside momentum was fading. Now, the 20-day Simple Moving Average (SMA) is in focus. A break under opens the door to facing rising support from March 2020.
S&P 500 Futures Daily Chart
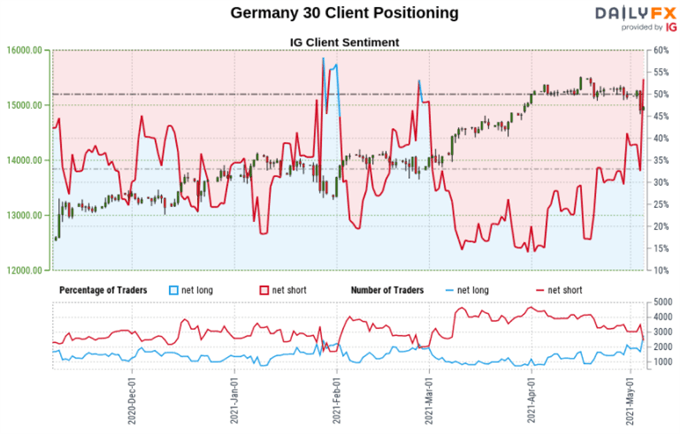
DAX 30 Sentiment Outlook - Bearish
The IGCS gauge implies that about 53% of retail traders are net long the DAX 30. Upside bets have climbed by 63.74% and 64.45% over a daily and weekly basis respectively. The combination of current sentiment and recent changes offers a stronger bearish contrarian trading bias.

Technical Analysis
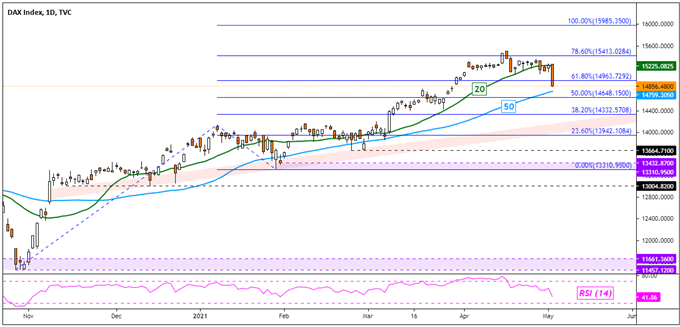
The DAX closed under the near-term 20-day SMA, exposing the 50-day line below it. This may have opened the door to extending April’s top. Having said that, rising support from November appears to be maintaining the medium-term upside focus. Closing under the 50-day SMA exposes this trendline.
DAX Daily Chart
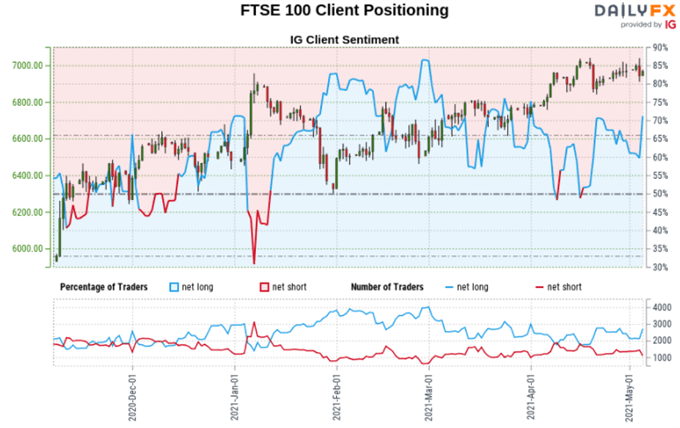
FTSE 100 Sentiment Outlook - Bearish
The IGCS gauge implies that about 70% of retail traders are net long the FTSE 100. Upside exposure increased by 23.12% over a daily basis, falling by 3.71% over a weekly timeframe. Still, the combination of current sentiment and recent changes offers a stronger bearish contrarian trading bias.

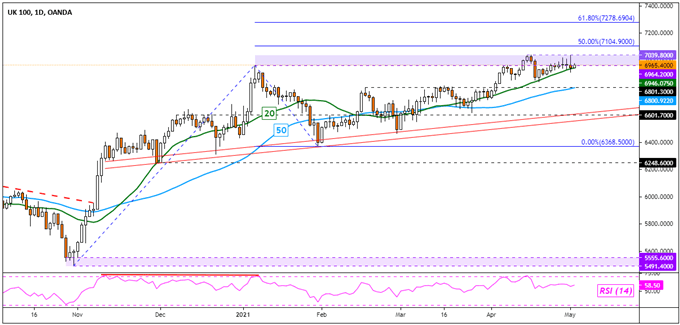
Technical Analysis
The FTSE 100 is struggling to pierce through the critical 6964 – 7039 resistance zone. Still, the 20-day SMA is appearing to maintain the upside bias. A break under it would then expose the 50-day line. Similar to the DAX, rising support from November could still maintain the medium-term upside focus.
FTSE 100 Daily Chart
*IG Client Sentiment Charts and Positioning Data Used from May 4th Report
--- Written by Daniel Dubrovsky, Strategist for DailyFX.com
To contact Daniel, use the comments section below or @ddubrovskyFX on Twitter


