


Bitcoin, Ethereum, Dogecoin – Talking Points
- Bitcoin breached below the 20-day SMA, threatening the 50k level
- Ethereum follows Bitcoin lower as 100-day SMA eyed for support
- Dogecoin’s explosive move may not be finished as the crypto asset steals the show

Bitcoin Technical Breakdown
Bitcoin is on the move lower, sinking the most on a daily basis since February, down over 7%. The current move lower has eaten into nearly half of the gains Bitcoin has made since its late April multi-month swing low. In the process, BTC/USD has breached below its 20-day Simple Moving Average (SMA), which could add to the overhead technical pressure facing the cryptocurrency.
Moreover, downward momentum may soon accelerate if the MACD oscillator crosses below its signal line. The first technical support area to the downside is the 100-day SMA near 51,678. Next up would be the 61.8% Fibonacci retracement level from the April to May move. Even lower lies the psychologically important 50k level, which, if breached, would likely put significant overhead pressure on Bitcoin. Alternatively, recapturing the 20-day SMA is likely key to restoring bullish energy.
BTC/USD Daily Chart
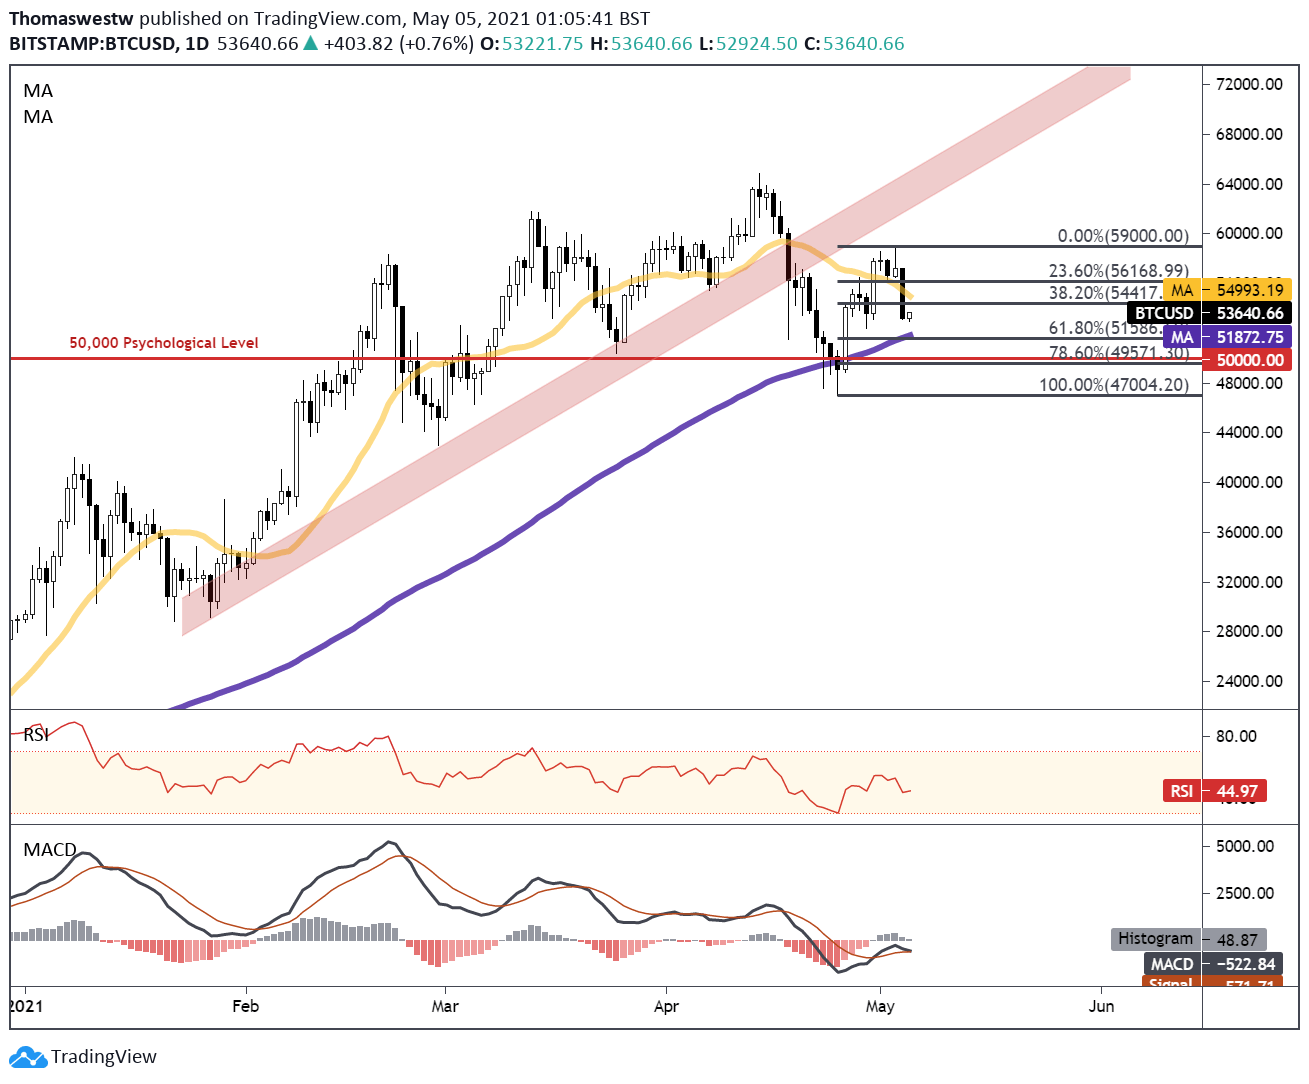
Chart created with TradingView
Ethereum Technical Breakdown
Ethereum is coming off its worst daily loss since April 24, sinking 5.59% on Tuesday. ETH has recovered a portion of those losses but remains off its recent all-time high. Given the strength in Ethereum’s broader trend higher, the recent pullback may be just that, a pullback before moving higher. That said, a break above 3,530 would put the cryptocurrency at new all-time highs, with a potentially critical resistance level overhead as the 4,000 psychological level.
The Relative Strength Index (RSI) remains in overbought territory, however. Prices may depreciate slightly before moving higher to correct the overbought conditions. If so, the 23.6% Fibonacci retracement level may offer support, but a deeper pullback would see the 3,000 level and 61.8% Fib as likely areas for bulls to step back in, with intermediate support being possibly offered from the 50-day Exponential Moving Average (EMA – blue line).
ETH/USD Daily Chart
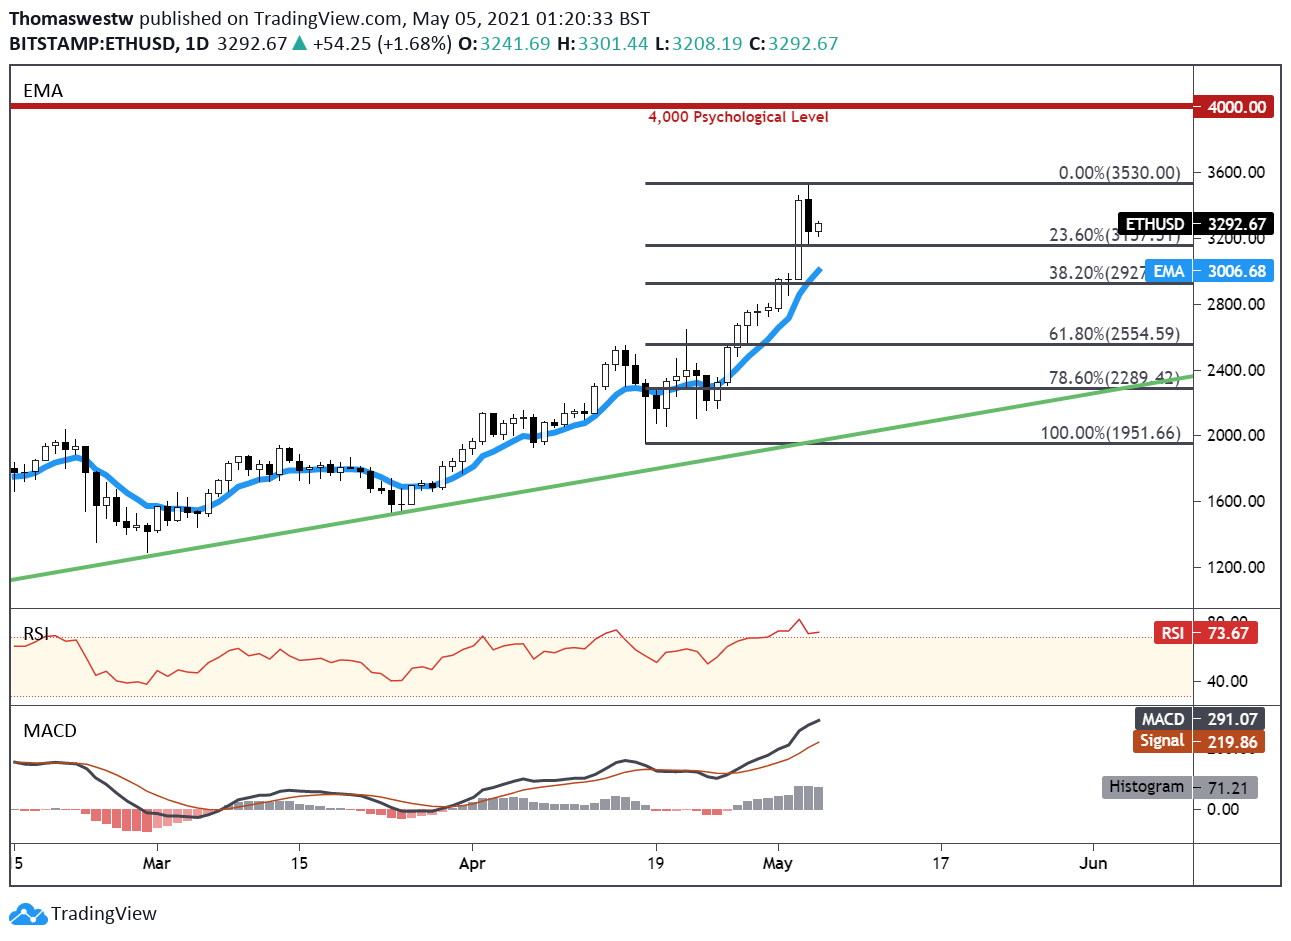
Chart created with TradingView
Dogecoin Technical Breakdown
Dogecoin has packed the most explosive upside energy in the crypto space over the last couple of weeks. A late April, a selloff put the cryptocurrency’s earlier rise in jeopardy, but strength reemerged and sent prices higher once again. The immediate move appeared to be guided higher by its 9-day EMA (blue line) before rocketing higher over the last 48 hours.
A move higher will likely see an intraday level of resistance seen earlier this week at the 0.60 psychological level. The 161.8% Fibonacci extension level would serve as a prompt resistance level and then the 261.8% Fib extension just above the psychological 90 handle – with intervening psychological levels at the 70 and 80 handles. Alternatively, a move lower would likely back up to the late April high before the aforementioned 9-day EMA steps in.
Dogecoin Daily Chart
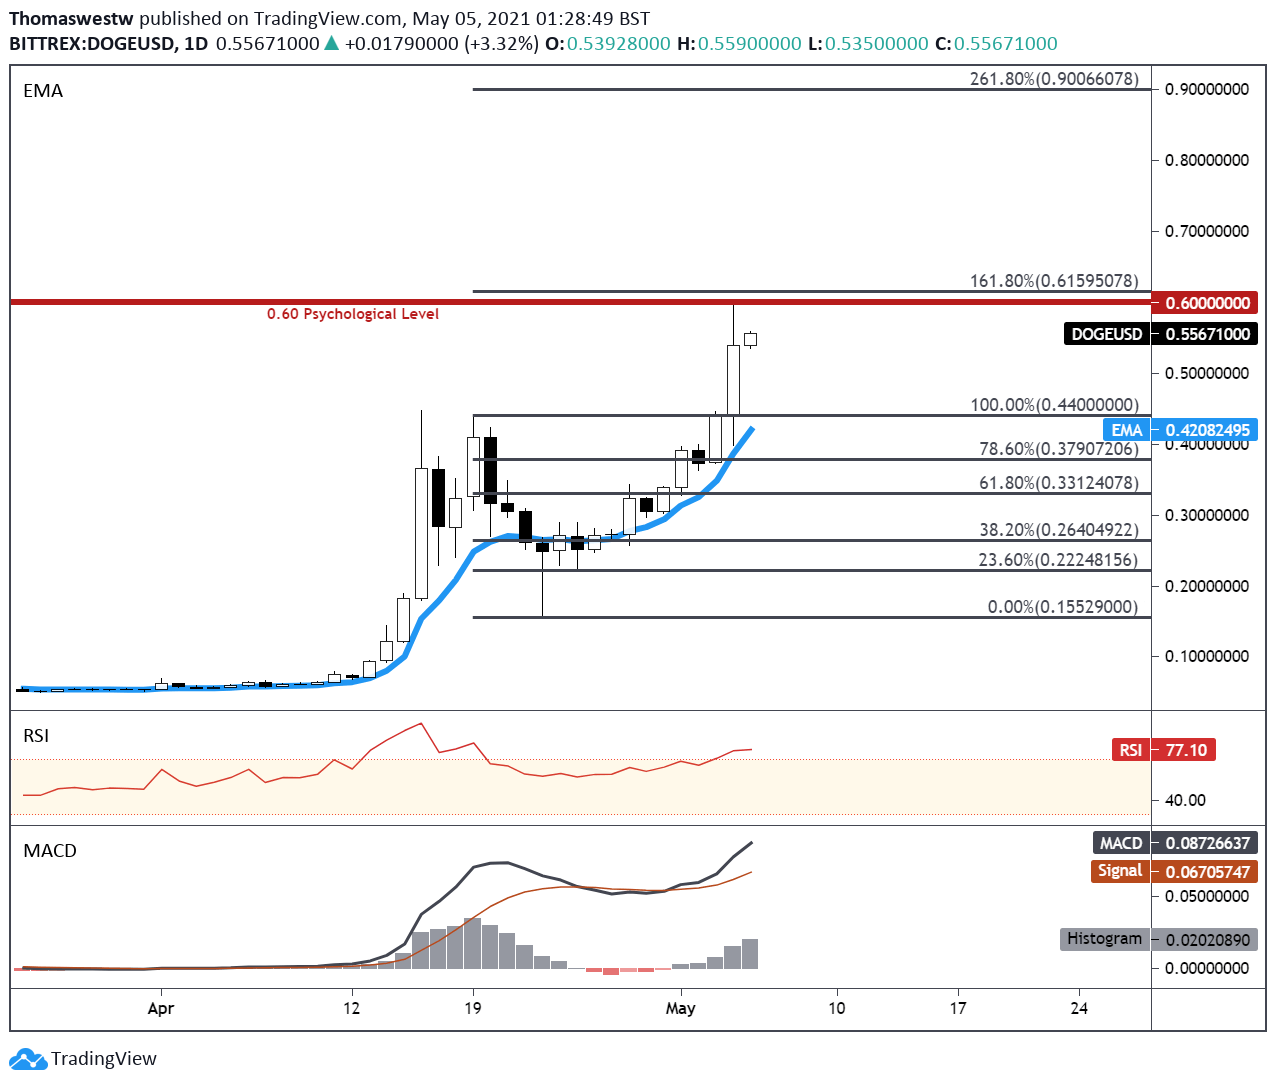
Chart created with TradingView
Bitcoin TRADING RESOURCES
- Just getting started? See our beginners’ guide for FX traders
- What is your trading personality? Take our quiz to find out
- Join a free webinar and have your trading questions answered
- Subscribe to the DailyFX Newsletter for weekly market updates
--- Written by Thomas Westwater, Analyst for DailyFX.com
To contact Thomas, use the comments section below or @FxWestwater von Twitter


