


Swiss Franc Technical Forecast – Talking Points
- AUD/CHF at risk of further downside after a trendline break
- NZD/CHF continued downside likely, but eyes short-term bounce
- EUR/CHF direction dependent on 50-day Simple Moving Average

AUD/CHF Technical Outlook
The Australian Dollar has surrendered ground against the Swiss Franc over the past week, breaking trendline support from the October 2020 swing low. AUD/CHF dropped 1.80% last week, its worst performance since June 2020, when the currency pair sank near 2.5%. While trendline support broke, the broader trend higher may still be in play.
A drop down to the psychologically imposing 0.70 handle may be on the cards. That round number may open AUD/CHF up to further losses if it fails to hold as support. The next large support level would see prices challenge the 100-day Simple Moving Average. Alternatively, recapturing the trendline along with the 50-day SMA would do much to put AUD/CHF back on a bullish path.
AUD/CHF Daily Chart
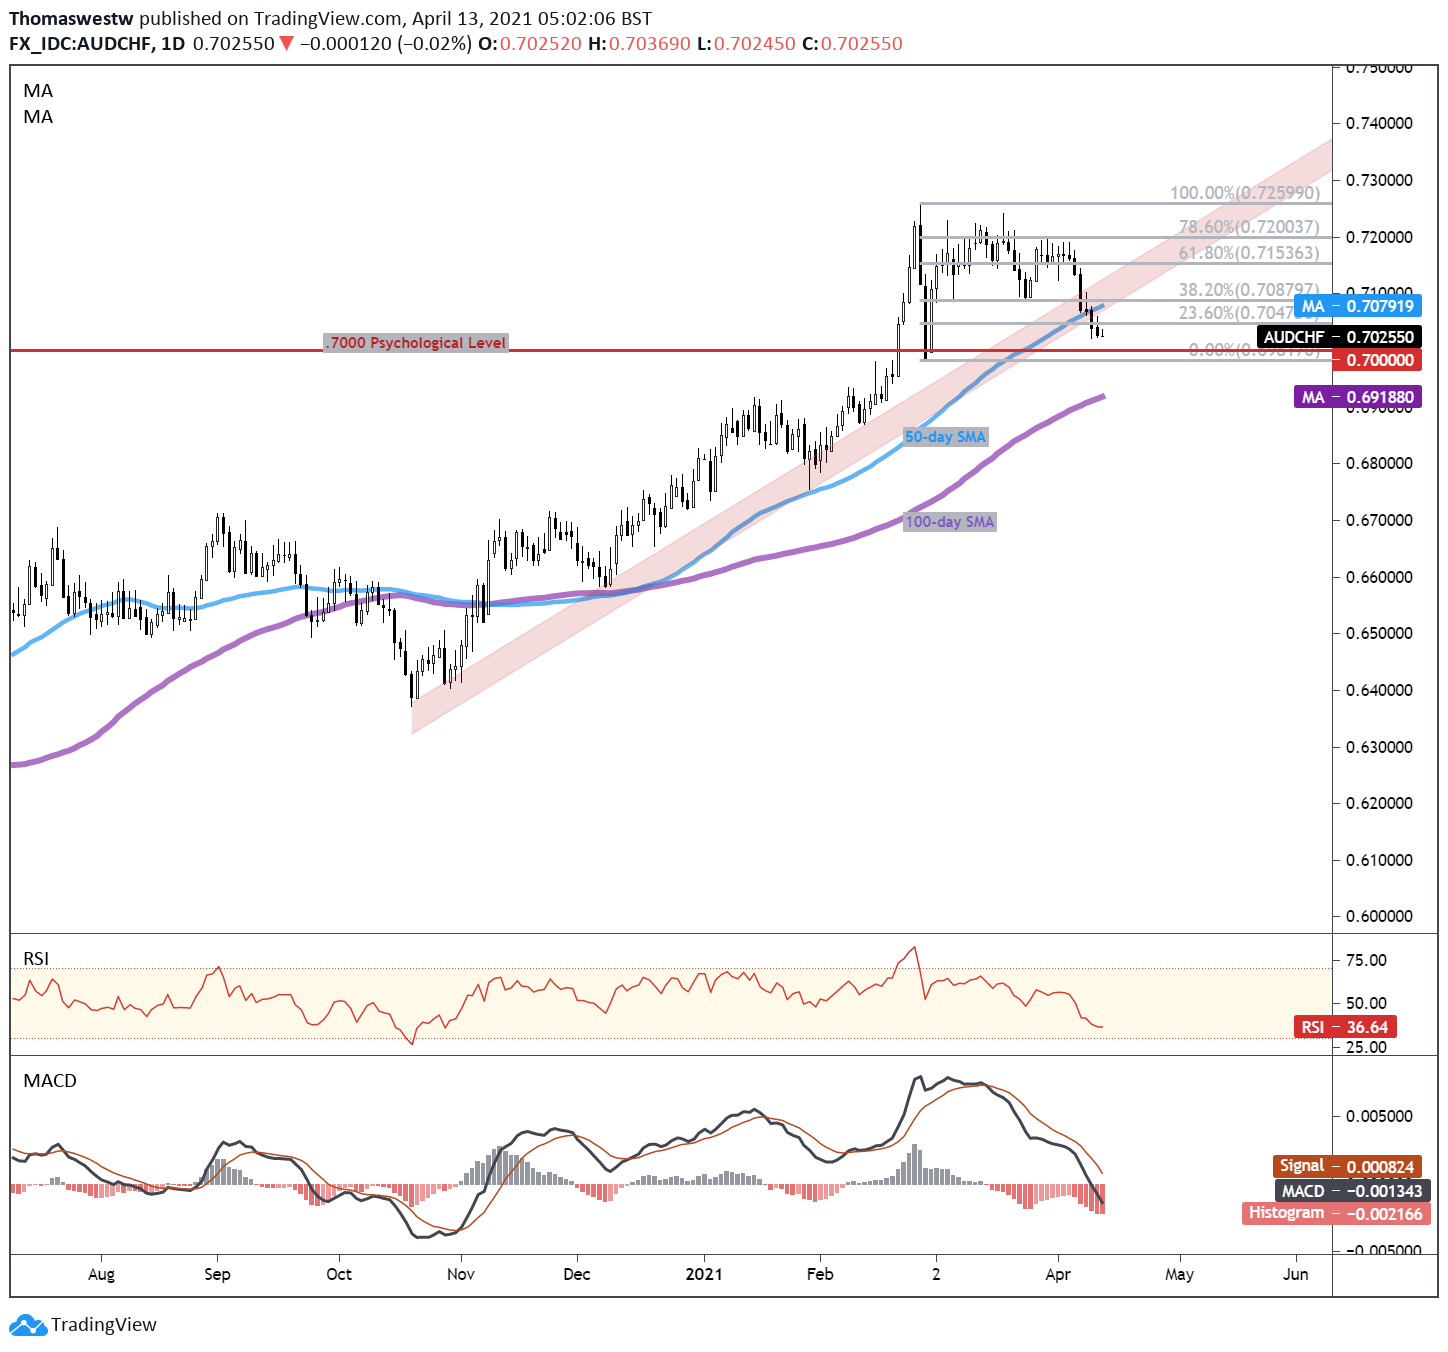
Chart created with TradingView
NZD/CHF Technical Outlook
The New Zealand Dollar has also been on the back foot against the Franc recently, with a near 2% drop last week in NZD/CHF. Monday’s trading saw further losses. The currency pair is now approaching its 100-day SMA. A drop below the key SMA could open up a floor of support seen through late February circa 0.6420.
A move higher, however, would see the 50-day SMA or trendline resistance from the late February multi-month swing high come into view, depending on the speed of the move higher. Trendline resistance likely serves as the most formidable upside obstacle. Breaching higher would likely see NZD/CHF extend gains from there. From the current viewpoint, the path lower appears to be favored.
NZD/CHF Daily Chart
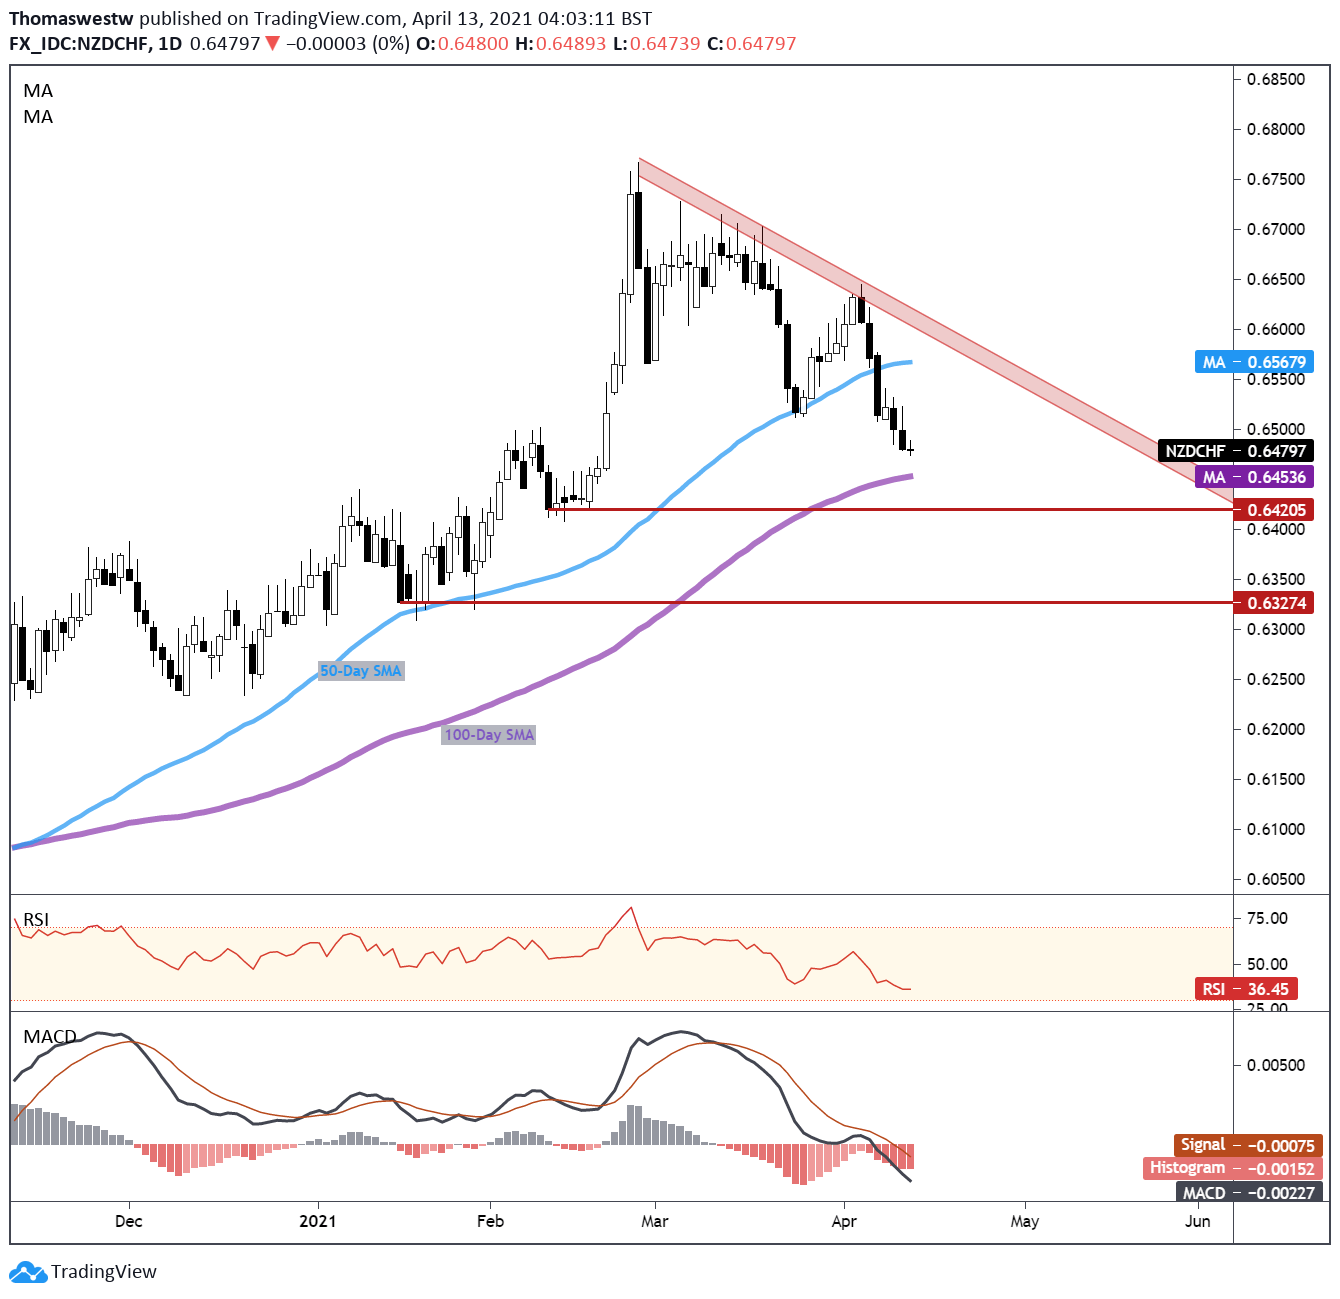
Chart created with TradingView
EUR/CHF Technical Outlook
The Euro is on track to record a second weekly loss against the Swiss Franc, with EUR/CHF chipping away at gains seen following an Ascending Triangle breakout from late February. Price is now at the 50-day SMA, which appears to be offering a level of support. MACD is nearing a bearish cross below its center line, however. The bearish technical signal may exert further pressure on EUR/CHF.
Breaching below the 50-day SMA may put enough overhead pressure on the pair to drag prices down to the former triangle’s horizontal line, where it may find a possible zone of support. Alternatively, if the 50-day SMA is defended, prices could attempt to rebound to the early March multi-month high at 1.1151.
EUR/CHF Daily Chart
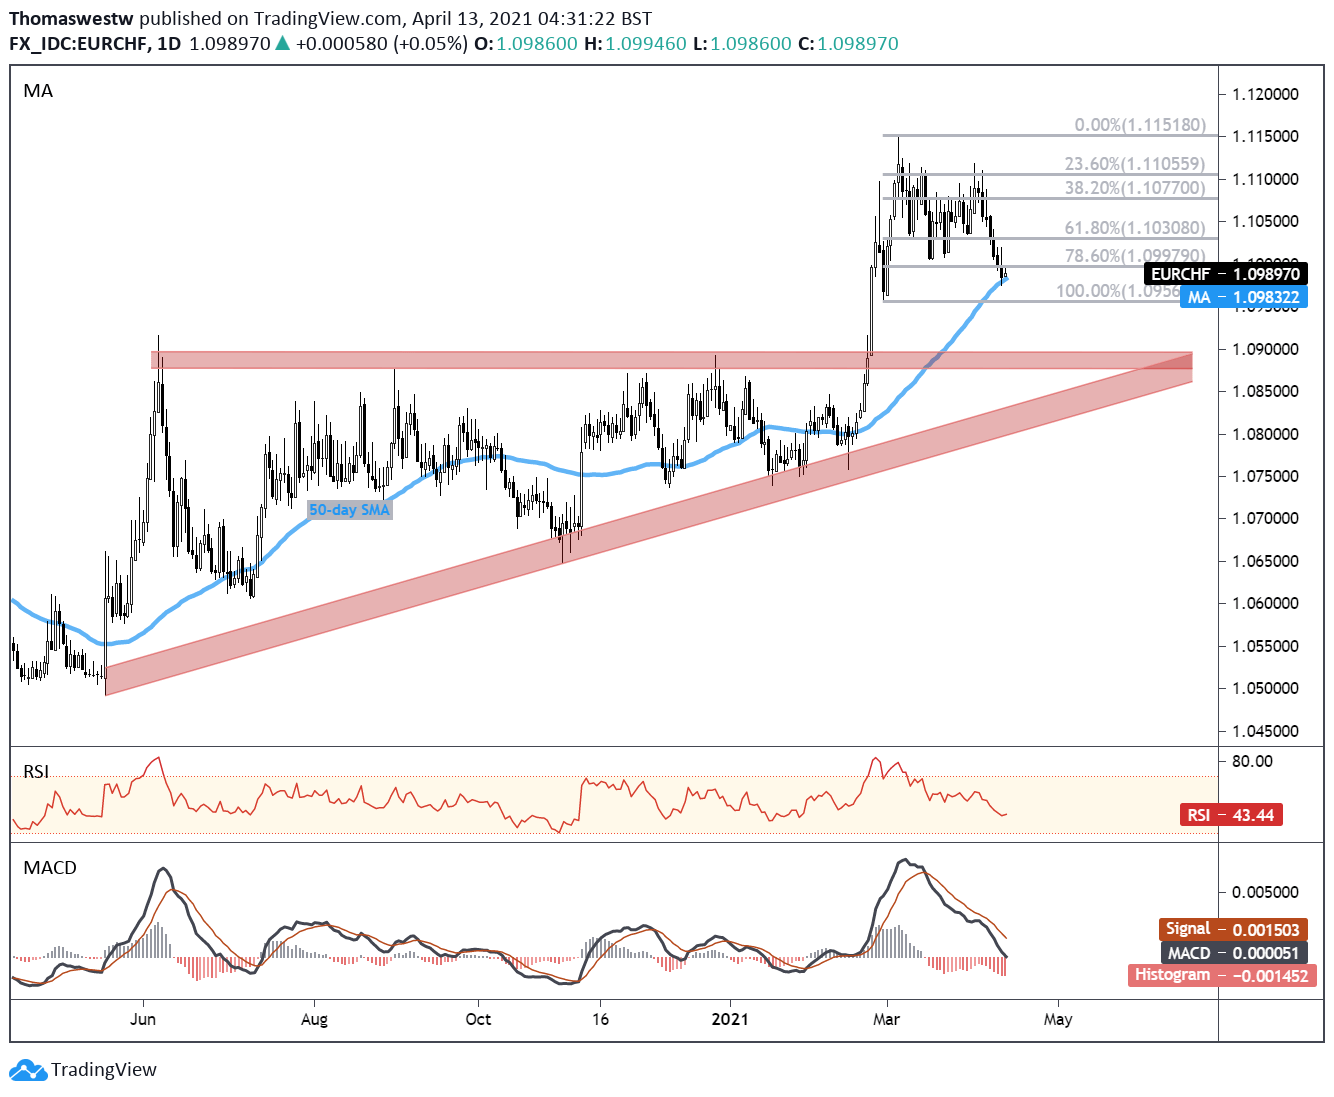
Chart created with TradingView

AUD/CHF, NZD/CHF, EUR/CHF TRADING RESOURCES
- Just getting started? See our beginners’ guide for FX traders
- What is your trading personality? Take our quiz to find out
- Join a free webinar and have your trading questions answered
- Subscribe to the DailyFX Newsletter for weekly market updates
--- Written by Thomas Westwater, Analyst for DailyFX.com
To contact Thomas, use the comments section below or @FxWestwater on Twitter


