


US Dollar, USD/SGD, USD/THB, USD/IDR, USD/PHP – ASEAN Technical Analysis
- US Dollar eyeing pivotal points versus ASEAN currencies as it gains
- USD/SGD, USD/THB, USD/IDR, USD/PHP all face 200-day SMAs
- Breaching long-term technical barriers opens door to deeper reversals

Singapore Dollar Technical Outlook
The US Dollar is attempting to climb against the Singapore Dollar after USD/SGD recently closed at its highest since early November. The pair broke above a falling zone of resistance from June, but follow-through has been lacking. This is where the 200-day Simple Moving Average (SMA) is coming into focus, as well as the 1.3527 – 1.3561 inflection zone. The former could maintain the dominant downside focus, with a drop under 1.3389 perhaps opening the door to revisiting January lows. Otherwise, November highs could be next.
USD/SGD Daily Chart
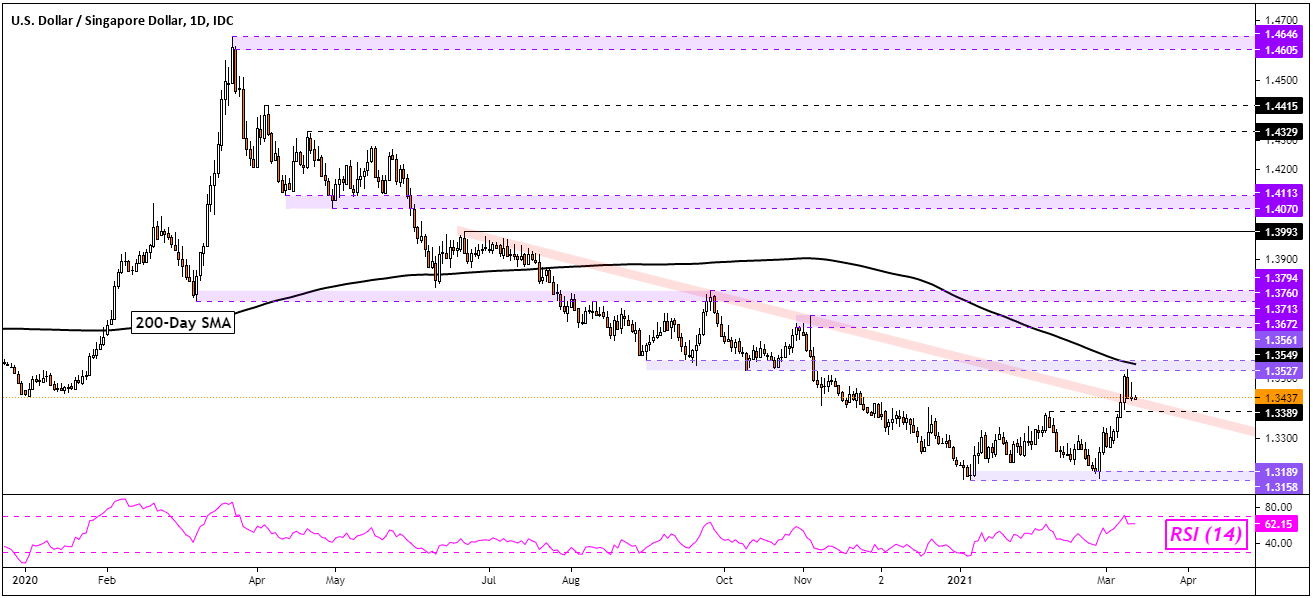
USD/SGD Chart Created in TradingView
Thai Baht Technical Outlook
The US Dollar is making relatively aggressive upside progress against the Thai Baht, with USD/THB confirming a break above a falling zone of resistance from April 2020. Prices are currently idling around the 200-day SMA which may maintain the downside focus. However, breaching the 38.2% Fibonacci extension at 30.9228 could open the door to further gains. Immediate support appears to be the 10-day SMA, with the 30.440 – 30.3560 inflection zone sitting just below that.

USD/THB Daily Chart

USD/THB Chart Created in TradingView
Indonesian Rupiah Technical Outlook
The US Dollar is also pushing higher against the Indonesian Rupiah, with USD/IDR attempting to confirm a break above the key 200-day SMA. Guiding the pair higher seems to be a near-term rising trendline from February. Prices are approaching the 14525 – 14563 inflection point. A breakout higher could open the door to revisiting highs from September. Otherwise, a turn lower under the rising trendline exposes the critical 13870 – 14012 support zone from the end of last year.
For updates on ASEAN currencies as they break key technical levels, be sure to follow me on Twitter @ddubrovskyFX.
USD/IDR Daily Chart

USD/IDR Chart Created in TradingView
Philippine Peso Technical Outlook
The Philippine Peso has remained fairly resilient to recent US Dollar strength, with the 200-day SMA maintaining the dominant downside focus in USD/PHP. The pair seems to have reinforced the 48.8230 – 48.9900 resistance zone. Prices seem to be eyeing the 48.2870 – 48.3600 inflection zone following recent losses. A break under this area could open the door to revisiting lows from February. Otherwise, pushing above key resistance exposes highs from July.

USD/PHP Daily Chart

USD/PHP Chart Created in TradingView
--- Written by Daniel Dubrovsky, Strategist for DailyFX.com
To contact Daniel, use the comments section below or @ddubrovskyFX on Twitter


