


Japanese Yen Technical Outlook – Talking Points
- USD/JPY may rise further with Golden Cross on the horizon
- NZD/JPY takes aim at recapturing its recent multi-year high
- CHF/JPY more neutral between a trendline and key SMAs

USD/JPY Technical Outlook
The US Dollar has been making major strides against the Japanese Yen since late January, with USD/JPY rising more than 5% year-to-date. While the cross has fallen back below the 109 handle since making a multi-month high this week, bullish momentum appears primed to continue as the US Dollar sees inflows, spurred by rising government bond yields. Thus, Yen weakness will likely persist against the Greenback.
USD/JPY appears to have found a layer of support at the 78.6% Fibonacci retracement level (108.298) from the June 2020 – January 2021 move. Prices may continue to test this Fib level given the Relative Strength Index (RSI) is in oversold territory with a declining MACD histogram reading. However, the formation of a Golden Cross appears to be in the making, which could bolster bullish sentiment.
USD/JPY Daily Chart
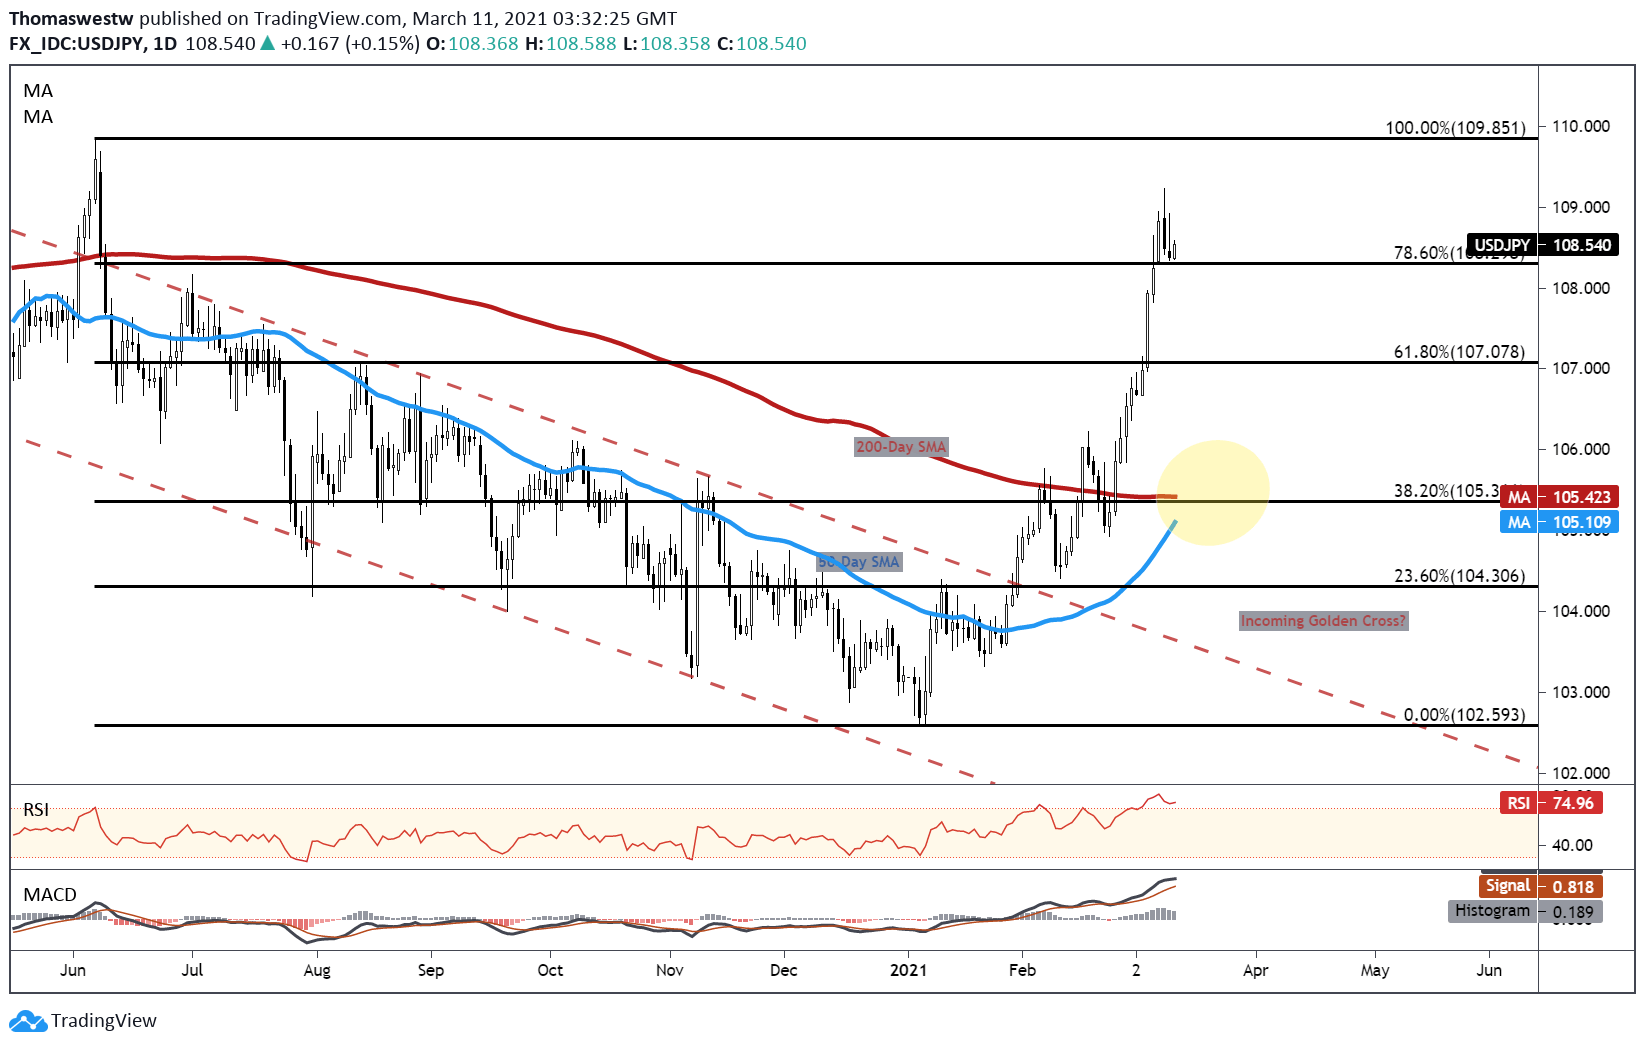
Chart created with TradingView
NZD/JPY Technical Outlook
The Yen’s technical outlook versus the New Zealand Dollar appears set to record more losses in the near term, with NZD/JPY accelerating to the upside. Since October, the cross has enjoyed a largely uninterrupted move higher. The 20-Day Simple Moving Average and trendline support has helped guide the cross to recent multi-year highs.
Currently, NZD/JPY is on course to cross above its 23.6% Fibonacci retracement level before setting aim on the February high – which serves as the highest level for the pair since early 2018. If prices manage to overtake that level, it could likely open the door for further gains. Alternatively, a move lower would have NZD bulls looking at the 20-day SMA for support, but a drop lower would likely open up the trendline for bears to attack.
NZD/JPY Daily Chart

Chart created with TradingView
CHF/JPY Technical Outlook
Stacked against the Swiss Franc, the Japanese Yen appears to have better odds than the previously covered pairs but the technical setup leaves much to be desired for Yen bulls. CHF/JPY is currently moving higher after trendline support from the May 2020 swing low rejected a move lower earlier this month. The Relative Strength Index (RSI) is neutrally positioned, but on the rise.
Downside momentum is ebbing, evidenced by the rising MACD line, which appears to be within days of a possible cross above its signal line. A move higher will need to clear the 38.2% Fibonacci retracement level from the November to February move. However, the 20- and 50-day Simple Moving Averages – which are positioned just above the Fib level -- may offer an additional area of resistance.
CHF/JPY Daily Chart

Chart created with TradingView
Japanese Yen TRADING RESOURCES
- Just getting started? See our beginners’ guide for FX traders
- What is your trading personality? Take our quiz to find out
- Join a free webinar and have your trading questions answered
--- Written by Thomas Westwater, Analyst for DailyFX.com
To contact Thomas, use the comments section below or @FxWestwater on Twitter


