


US Dollar, USD/SGD, USD/PHP, USD/THB, USD/IDR – ASEAN Technical Analysis
- USD/SGD is turning higher within a bearish Rectangle chart pattern
- USD/PHP soars, pressuring pivotal 200-day simple moving average
- USD/THB and USD/IDR also broke higher, will momentum carry?

Singapore Dollar Technical Outlook
Recently, the US Dollar has been making cautious progress against ASEAN currencies, including the Singapore Dollar. USD/SGD appears to be consolidating within a Bearish Rectangle, having bounced off the floor which makes for a zone of support between 1.3158 and 1.3215. That may place the focus on the ceiling, with resistance between 1.3375 and 1.3404. A breakout under the rectangle would expose lows from 2018. On the other hand, a push above the ceiling may place the focus on a falling zone of resistance from June.
USD/SGD Daily Chart

USD/SGD Chart Created in TradingView
Philippine Peso Technical Outlook
The Philippine Peso has been particularly under pressure against the US Dollar as of late, following persistent low volatility. USD/PHP is trading around the highest since August, with the pair pressuring the long-term 200-day Simple Moving Average. A climb above this line, as well as the 48.68 – 48.82 resistance zone, would expose the 49.31 inflection point from early July – see chart below. Otherwise, a turn lower places the focus on the 48.36 – 48.28 inflection zone.

USD/PHP Daily Chart

USD/PHP Chart Created in TradingView
Thai Baht Technical Outlook
The Thai Baht is also under pressure, with USD/THB trading around its highest since late November. Moreover, the pair broke above a Descending Triangle chart pattern, opening the door to extending gains. That may place the focus on a potential falling trendline from April, it could reinstate the dominant focus to the downside. Above also sits the 30.35 – 30.44 resistance zone. A climb above these would expose the former low from June. Downtrend resumption entails a drop through the December low at 29.75.

USD/THB Daily Chart
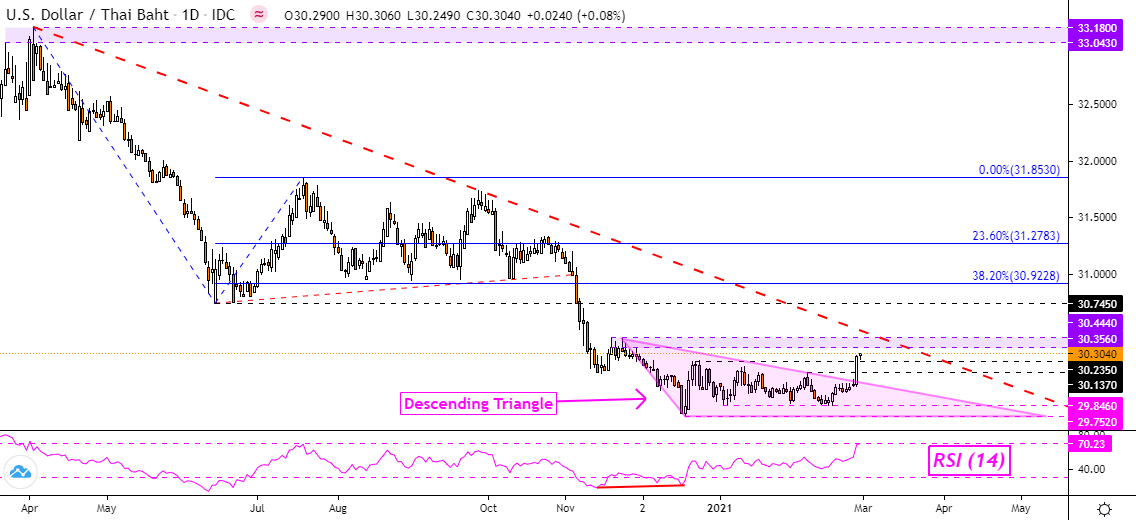
USD/THB Chart Created in TradingView
Indonesian Rupiah Technical Outlook
The US Dollar broke higher against the Indonesian Rupiah, with USD/IDR confirming a push above a falling zone of resistance from September. Now, the pair may be eyeing the 100-day SMA which could reinstate the focus to the downside. The 14280 resistance point is another potentially pivotal point, a break above it would expose the 14525 – 14563 inflection point. Otherwise, a turn lower from here would place the focus on the 13870 – 14012 support zone.
For updates on ASEAN currencies as they break key technical levels, be sure to follow me on Twitter @ddubrovskyFX.
USD/IDR Daily Chart

USD/IDR Chart Created in TradingView
--- Written by Daniel Dubrovsky, Strategist for DailyFX.com
To contact Daniel, use the comments section below or @ddubrovskyFX on Twitter


