


BTC/USD Technical Outlook
BTC/USD tests parabolic curve
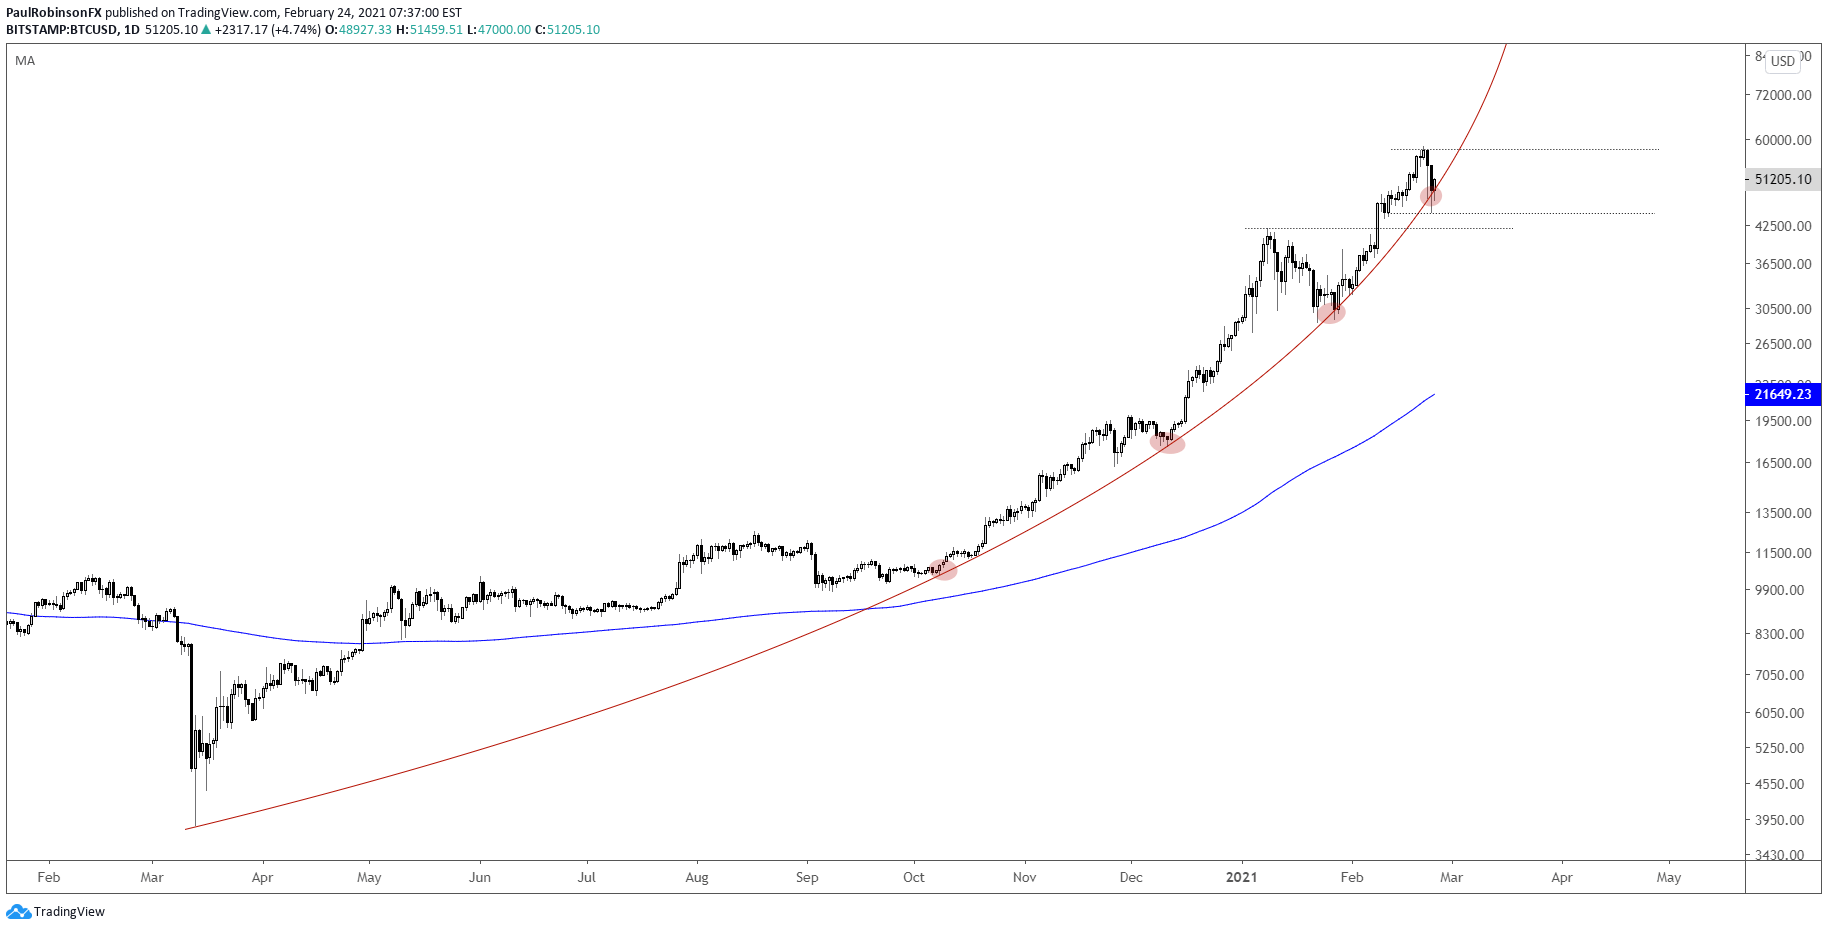
BTC/USD pullback has the parabolic curve in play, a structure that has gained importance as Bitcoin’s meteoric rise continues. Yesterday the curve was put thoroughly to the test, breaching it intraday, but closing out the session back above. As long as it stays above on a closing basis, then all remains well. But, if it breaks, this will open up a door for a much larger decline. At some point it will break, but will it be now or at a later time after BTC has risen even further? Not going to speculate on the timing, just simply following the curve for determining the trading bias.

BTC/USD Log Chart (Parabolic curve)
Resources for Forex Traders
Whether you are a new or experienced trader, we have several resources available to help you; indicator for tracking trader sentiment, quarterly trading forecasts, analytical and educational webinars held daily, trading guides to help you improve trading performance, and one specifically for those who are new to forex.
---Written by Paul Robinson, Market Analyst
You can follow Paul on Twitter at @PaulRobinsonFX


