


US Dollar, USD/SGD, USD/PHP, USD/THB, USD/IDR – ASEAN Technical Analysis
- USD/SGD break under short-term rising support lacking momentum
- USD/PHP sees deviation from quiet trade, challenging 100-day SMA
- USD/THB and USD/IDR are challenging important falling trendlines

Singapore Dollar Technical Outlook
The Singapore Dollar is struggling to advance against the US Dollar after USD/SGD broke under short-term rising support from earlier this year. Prices paused on the 1.3218 support point, with the pair generally consolidating since late December. The 100-day Simple Moving Average is nearing, piercing the key 1.3370 – 1.3404 resistance zone. It may reinstate the focus to the downside. Resuming the dominant downtrend entails a fall through the 1.3158 January low towards bottoms seen in 2018.
USD/SGD Daily Chart
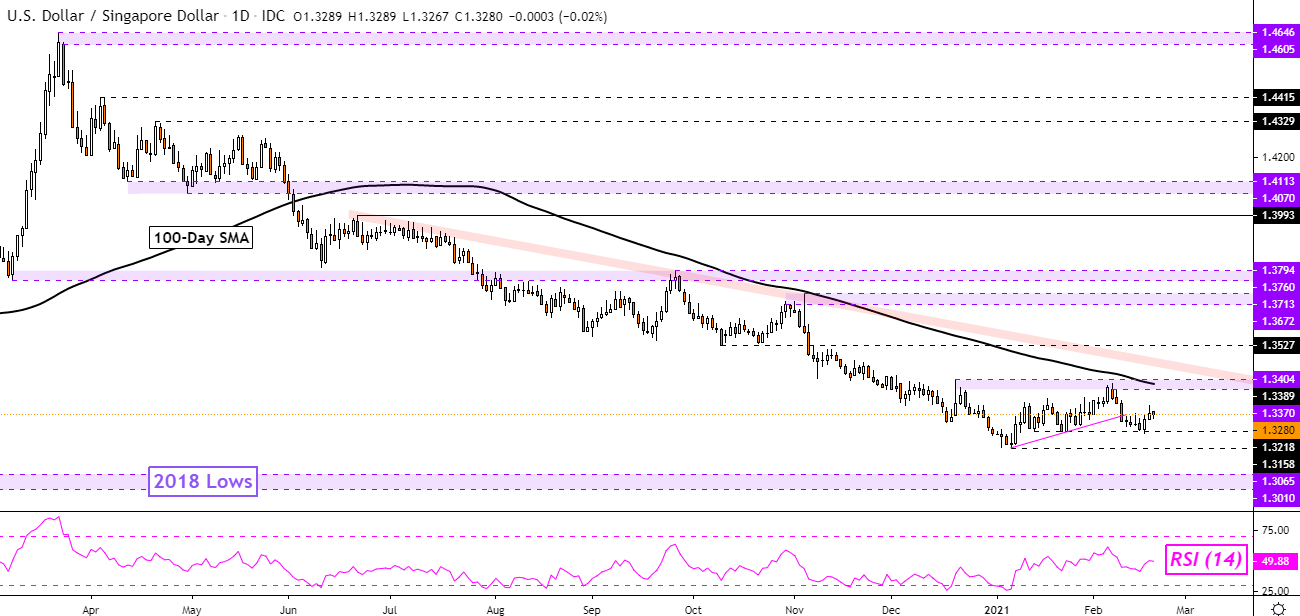
USD/SGD Chart Created in TradingView
Philippine Peso Technical Outlook
The US Dollar has been able to make some aggressive moves against the Philippine Peso as of late. USD/PHP experienced its largest 2-day rally since June, climbing almost 1 percent over Tuesday and Wednesday. Philippine Central Bank Governor Benjamin Diokno downplayed hawkish expectations recently, saying that it is too soon to consider a rate hike despite some signs of accelerating inflation.
As a result of the price action, USD/PHP is aiming to hold above the 100-day SMA as the pair tests the 48.2870 – 48.3600 inflection zone. Given a confirmatory hold above this zone, that could open the door to revisiting the 48.6800 – 48.8230 resistance range. Otherwise, a turn lower has key support eyed at 47.8670 followed by 47.6780.

USD/PHP Daily Chart
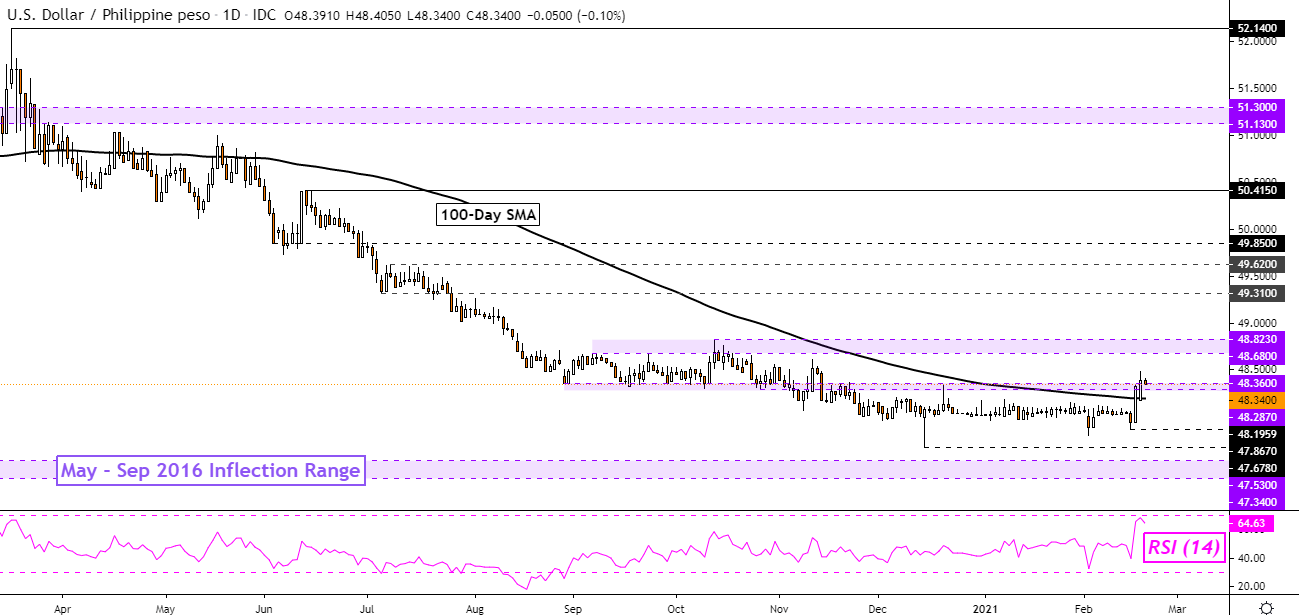
USD/PHP Chart Created in TradingView
Thai Baht Technical Outlook
The Thai Baht continues to consolidate against the US Dollar, though a falling zone of resistance from November seems to be guiding the pair cautiously lower. A key support area to breach under would be the 29.7200 – 29.7780 range as it has its beginnings from the end of 2019 and 2020 – see chart below. Climbing above falling resistance on the other hand exposes key levels to watch for at 30.1370 and then at 30.2350. Beyond that sits the 30.3560 – 30.4440 zone.

USD/THB Daily Chart
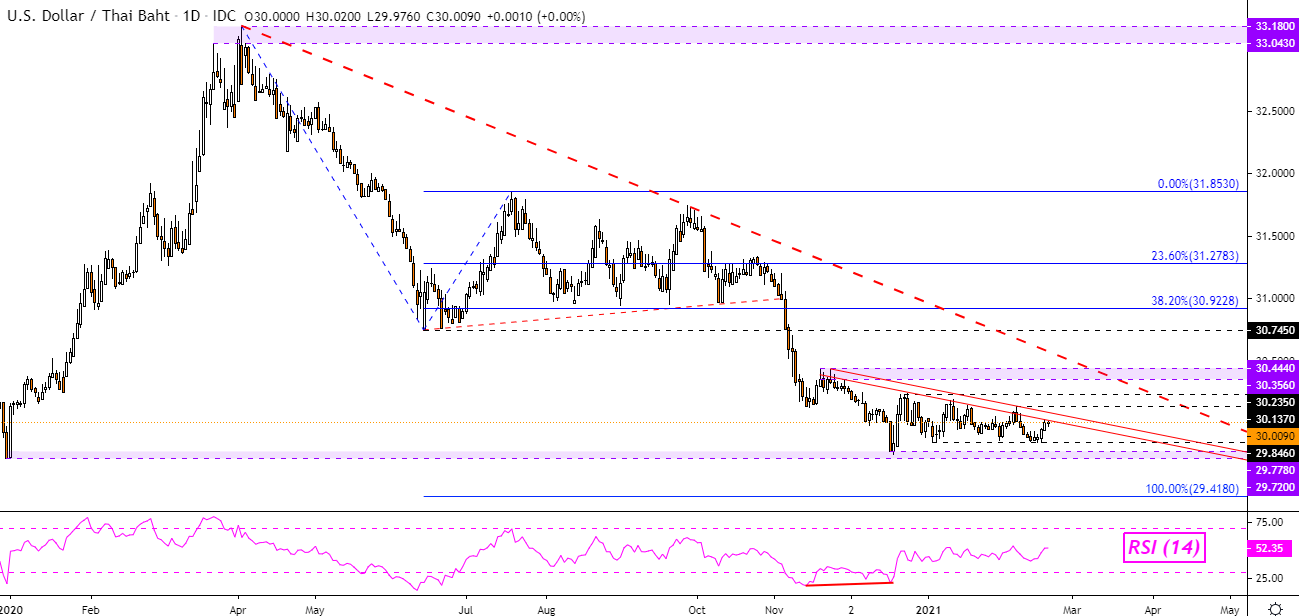
USD/THB Chart Created in TradingView
Indonesian Rupiah Technical Outlook
The Indonesian Rupiah is pressuring a key falling zone of resistance from September against the US Dollar. This follows USD/IDR pausing losses on the lower boundary of the 13870 – 14012 support zone. Generally speaking, the pair has been in a consolidative state since November. A break above falling resistance would expose the December high at 14280. Otherwise, a turn lower may place the focus on the 2020 low at 13560.
For updates on ASEAN currencies as they break key technical levels, be sure to follow me on Twitter @ddubrovskyFX.
USD/IDR Daily Chart

USD/IDR Chart Created in TradingView
--- Written by Daniel Dubrovsky, Strategist for DailyFX.com
To contact Daniel, use the comments section below or @ddubrovskyFX on Twitter


