


Dow Jones, S&P 500, Technical Analysis, Retail Trader Positioning - Talking Points
- Recent gains in the Dow Jones, S&P 500 tapering
- IGCS appears to be hinting at a turn lower ahead
- AUD/USD, USD/JPY discussed in webinar above
In this week’s webinar on IG Client Sentiment (IGCS), I discussed the outlook for the Dow Jones and S&P 500. IGCS is typically a contrarian indicator, a tool that I incorporated with fundamental and technical analysis. For a deeper dive into where these assets may go, alongside commentary on AUD/USD and USD/JPY, check out the recording of the session above.
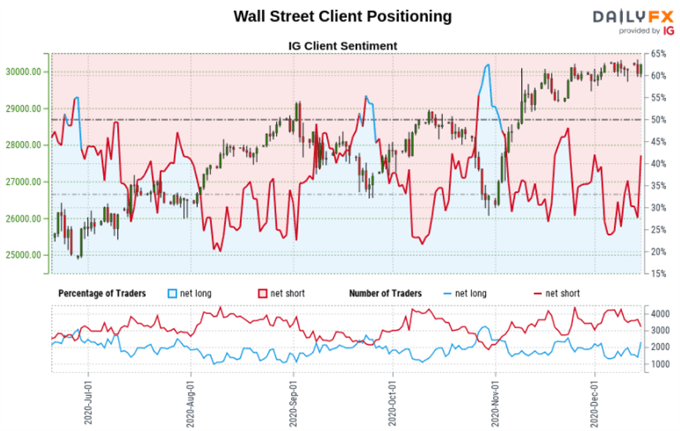
Dow Jones Sentiment Outlook - Bearish
The IGCS gauge shows that about 38% of retail traders are net long. Upside exposure has increased by 13.08% and 26.67% over a daily and weekly basis respectively. Recent changes in sentiment warn that the currentprice trend may soon reverse lower despite the fact traders remain netshort.
Dow Jones Technical Analysis
Negative RSI divergence has been warning that upside momentum in the Dow Jones has been fading. This can at times precede a turn lower, with prices idling just under the 38.2% Fibonacci extension at 30190 on the daily chart below. A turn under the short-term 20-day Simple Moving Average places the focus on early 2020 highs between 29263 and 29523 which could act as new support.
Dow Jones Futures Daily Chart
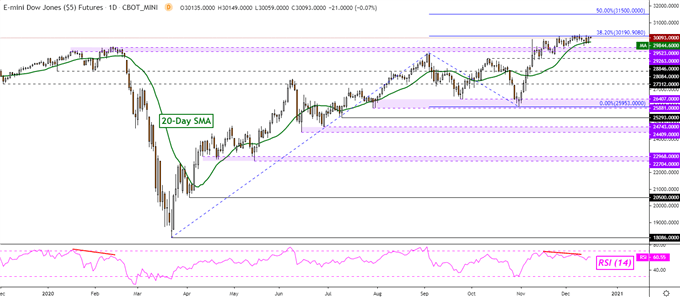
Dow Jones Chart Created in Trading View
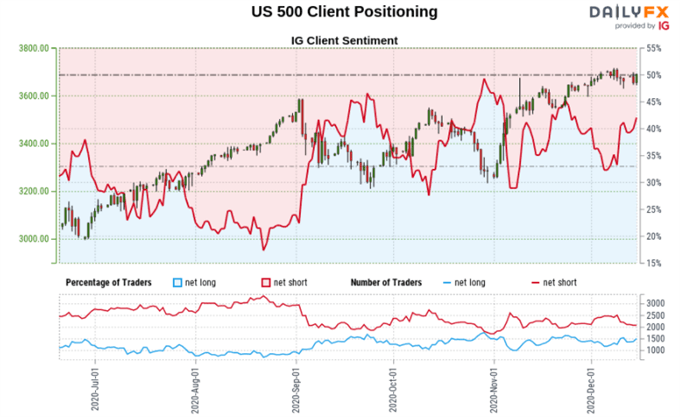
S&P 500 Sentiment Outlook - Bearish
The IGCS gauge implies that about 42% of retail investors are net long the S&P 500. Upside exposure climbed by 9.83% and 24.28% over a daily and weekly basis respectively. Recent changes in sentiment warn that the current price trend may soon reverse lower despite the fact traders remain netshort.

S&P 500 Technical Analysis
The 20-day SMA recently acted as support in the S&P 500, aiding to help keep the focus to the upside despite short-term losses after December 8th. A drop through the SMA exposes the former 3541 – 3587 resistance zone, which could act as new support. Otherwise, a push above the 38.2% Fibonacci extension at 3737 exposes the midpoint at 3904.
S&P 500 Futures – Daily Chart
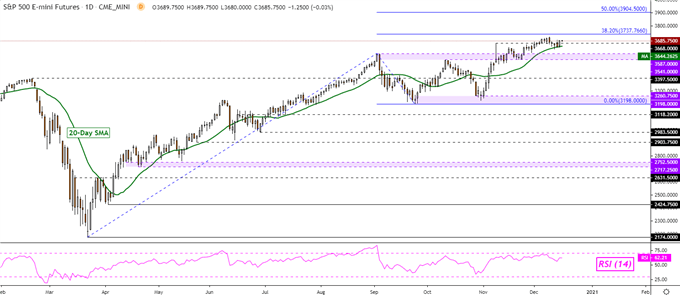
S&P 500 Chart Created in Trading View
*IG Client Sentiment Charts and Positioning Data Used from December 16th Report
--- Written by Daniel Dubrovsky, Currency Analyst for DailyFX.com
To contact Daniel, use the comments section below or @ddubrovskyFX on Twitter


