


Bitcoin (BTC/USD), Litecoin (LTC/USD), Ripple (XRP/USD), Technical Analysis – Talking Points
- Bitcoin is fast approaching 2018 highs, but momentum is fading
- Litecoin surges in best day in over 8 months towards resistance
- Ripple confirmed a push above key resistance, momentum holds
Bitcoin rose over 4.6% on Monday, extending remarkable gains that have pushed the cryptocurrency to set new highs this year. One of the more prominent fundamental forces driving it upward has been the boost to money supplies around the world thanks to central banks.
Given recent price action, might BTC/USD, Litecoin and Ripple prolong their momentum? Do keep in mind that cryptocurrencies can be quite volatile, and investors ought to take this into account in developing their unique trading styles. To find out which style may fit your personality, check out our DNA quiz here.
Bitcoin Technical Outlook
Bitcoin is fast approaching the 2018 high at 17178 after BTC/USD took out the 78.6% Fibonacci extension at 16595. Confirmation is lacking however. A further upside push may open the door to extending gains. However, negative RSI divergence is present. This shows that upside momentum is fading and can at times precede a turn lower. Key support sits below at 15145 which is the 61.8% Fibonacci extension.
Still, a bullish ‘Golden Cross’ formed back in October and remains in play. This is when the short term 20-day Simple Moving Average (SMA) crosses above the medium term 50-day one. As such, keep a close eye on these lines in the event of a turn lower as they may act as support. Otherwise, Bitcoin could be setting course to revisit the all-time high set back in 2017 before the cryptocurrency bubble burst.

BTC/USD - Daily Chart

Litecoin Technical Outlook
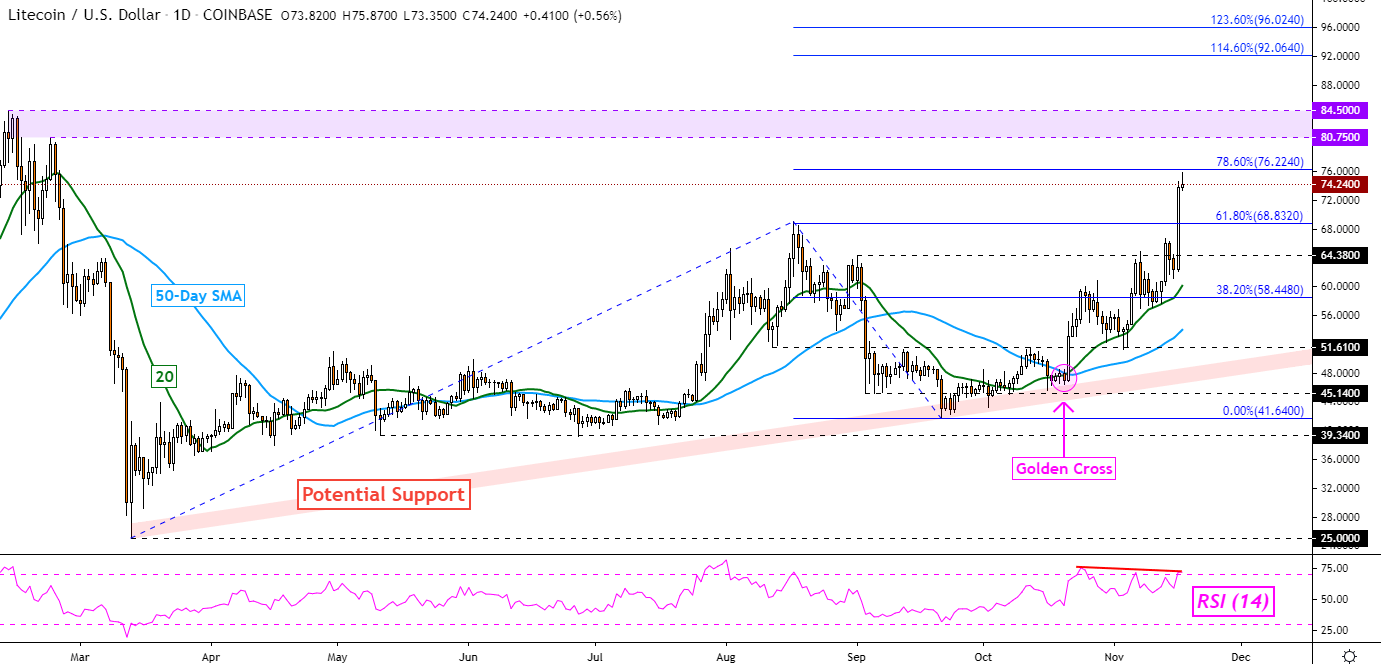
Litecoin surged 18.37% on Monday in its largest single-day surge in over 8 months. That has pushed LTC/USD above the 61.8% Fibonacci extension at 68.83. Prices stopped short of the 78.6% extension at 76.22. Taking out this price could open the door to testing current 2020 peaks which would make for a zone of resistance between 80.75 and 84.50.
This is underscored by a bullish ‘Golden Cross’ formed back in October. Taking out those highs would subsequently expose the 114.6% minor extension at 92.06. However, negative RSI divergence suggests that upside momentum is fading. Falling back under the 61.8% extension exposes the 64.38 inflection point as well as the 20-day and 50-day SMAs.

LTC/USD - Daily Chart
Ripple Technical Outlook
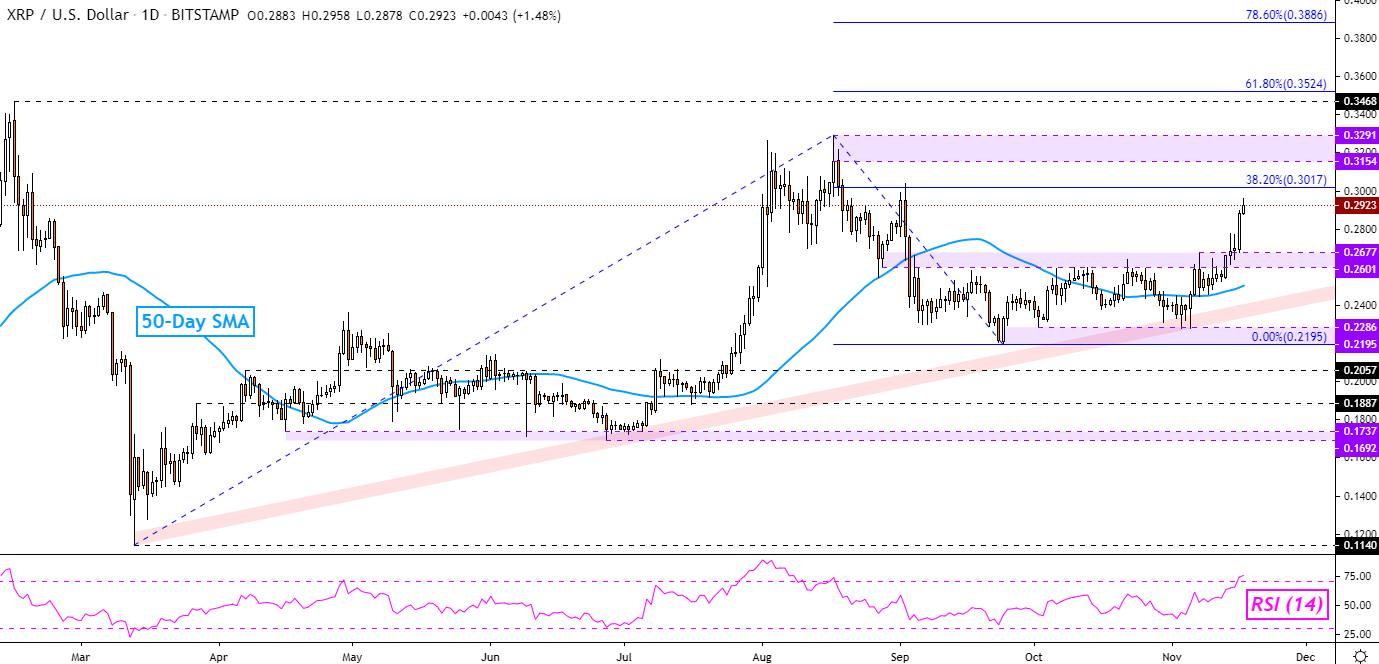
Ripple has also extended higher as of late, pushing above the 0.2601 – 0.2677 inflection zone. Prices are approaching the 38.2% Fibonacci extension at 0.3017 as LTC/USD aims for August highs. The latter would make for a zone of resistance between 0.3154 and 0.3291. Beyond that sit current 2020 peaks. In the event of a turn lower, keep a close eye on the 50-day SMA which could act as support. Another point of interest is a rising range of support from March – red area on the chart below.
XRP/USD - Daily Chart
--- Written by Daniel Dubrovsky, Currency Analyst for DailyFX.com
To contact Daniel, use the comments section below or @ddubrovskyFX on Twitter


