


S&P 500, Dow Jones, Gold, Trader Positioning - Talking Points
- How are retail traders positioned in markets after the US election?
- S&P 500 may be at risk to falling, will Dow and gold prices follow?
- AUD/USD, NZD/USD, GBP also analyzed in the webinar recording
In this week’s webinar on IG Client Sentiment (IGCS), I discussed the outlook for the S&P 500, Dow Jones and gold prices in the aftermath of the US presidential election. IGCS is a contrarian indicator. For a deeper dive into what this means and for fundamental analysis, check out the recording of the session above where I also outlined the road ahead for AUD/USD, NZD/USD and GBP/USD.
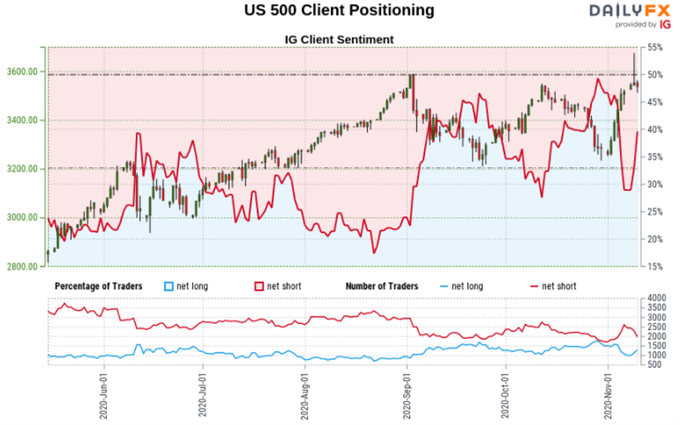
S&P 500 Sentiment Outlook - Bearish
The IGCS gauge implies that about 43% of retail traders are net long the S&P 500. Downside exposure has decreased by 2.07% and 10% over a daily and weekly basis respectively. Recent changes in sentiment warn that the current price trend may soon reverse lower despite the fact traders remain net short.
S&P 500 Technical Analysis
From a technical standpoint, the S&P 500 could be at risk to turning lower following negative RSI divergence. This shows that upside momentum is fading as prices test the upper zone of consolidation between 3541 and 3587. Prices struggled to hold a climb above it on Monday, leaving behind a large upper wick. A reversal from here could place the focus on the lower zone of consolidation between 3198 and 3260.
S&P 500 Futures – Daily Chart

S&P 500 Chart Created in Trading View
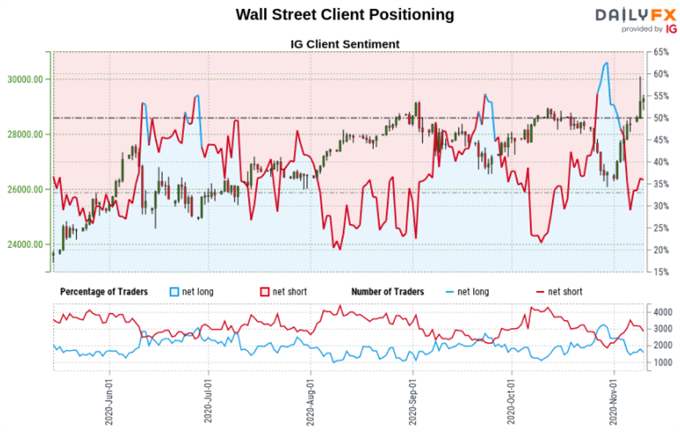
Dow Jones Sentiment Outlook - Bullish
The IGCS gauge implies that about 35% of retail investors are net long the Dow Jones. Upside exposure has decreased by 1.69% and 20% over a daily and weekly basis respectively. The combination of current sentiment and recent changes offers a stronger bullish contrarian trading bias.

Dow Jones Technical Analysis
The Dow Jones is testing all-time highs achieved earlier this year, making for a zone of resistance between 29263 and 29523. Prices left behind a large upper wick on Monday, reinforcing this technical barrier. Negative RSI divergence warns that upside momentum is fading. A turn lower from here could open the door to revisiting the 25881 – 26407 support zone.
Dow Jones Futures – Daily Chart
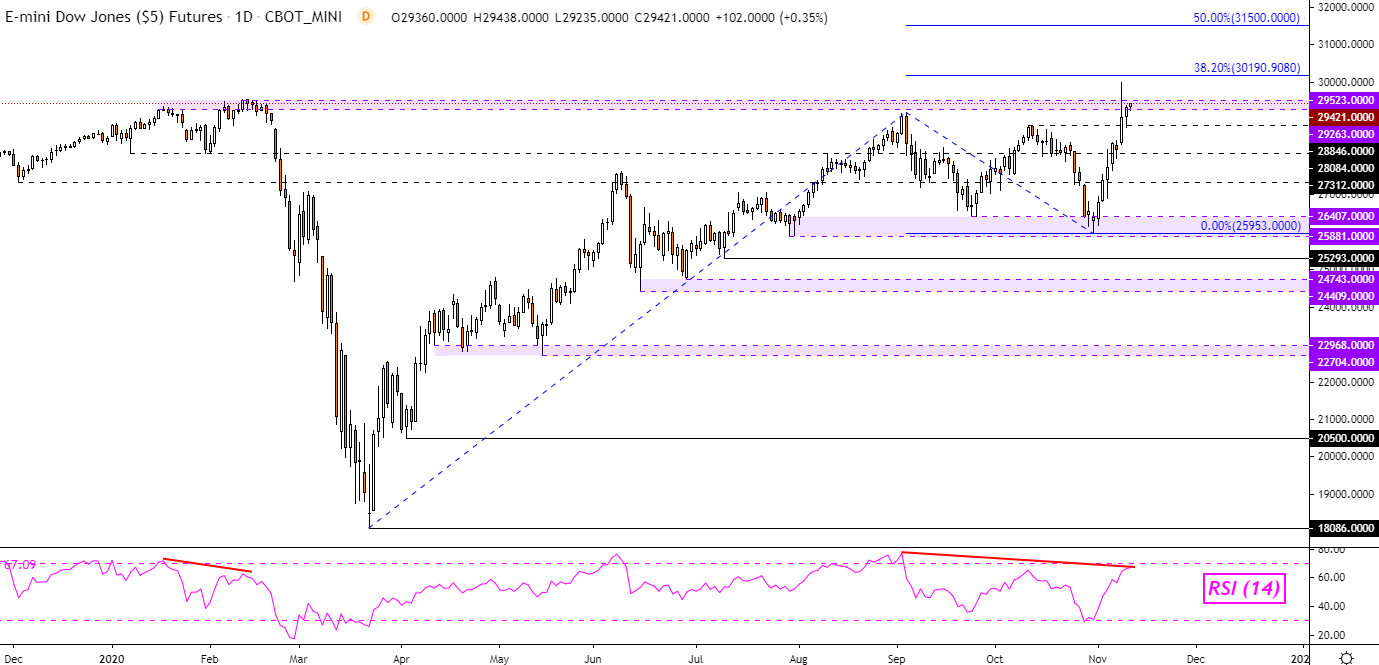
Dow Jones Chart Created in Trading View
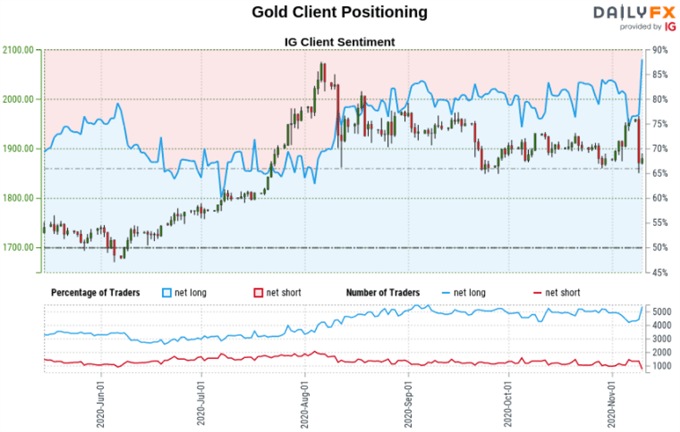
Gold Sentiment Outlook - Neutral
The IGCS gauge implies that about 83% of retail traders are net long gold. Downside exposure has increased by 26.8% over a daily basis while declining 14.29% over a weekly period. The combination of current sentiment and recent changes offers a further mixedtrading bias.

Gold Technical Analysis
Following heavy losses on Monday, gold prices paused losses on the critical 1848 – 1863 support zone. This has also placed the bearish ‘Death Cross’ back in play on the daily chart below. Positive RSI divergence shows that downside momentum is fading in the yellow metal. This could precede a turn higher towards the 20-day and 50-day Simple Moving Averages.
XAU/USD – Daily Chart

Gold Chart Created in Trading View
*IG Client Sentiment Charts and Positioning Data Used from November 10th Report
--- Written by Daniel Dubrovsky, Currency Analyst for DailyFX.com
To contact Daniel, use the comments section below or @ddubrovskyFX on Twitter


