


US Dollar Analysis, Coronavirus, Mexican Peso, South Korean Won, South African Rand - Talking Points
- USD/MXN recovery may be in the works but faces near-term resistance
- USD/KRW broke below multi-month support, but will the bears prevail?
- USD/ZAR compression zone may stymie or exacerbate the pair’s selloff
USD/MXN Analysis
After topping at 22.6994-22.4160 resistance range, USD/MXN subsequently declined almost 10 percent, but the selloff appears to now be reversing. Perhaps not entirely by coincidence, the turnaround is occurring near what looks like technically-significant support at 20.7621. USD/MXN has encountered some friction here dating all the way back to March during the pair’s unprecedented ascent.
USD/MXN - Daily Chart
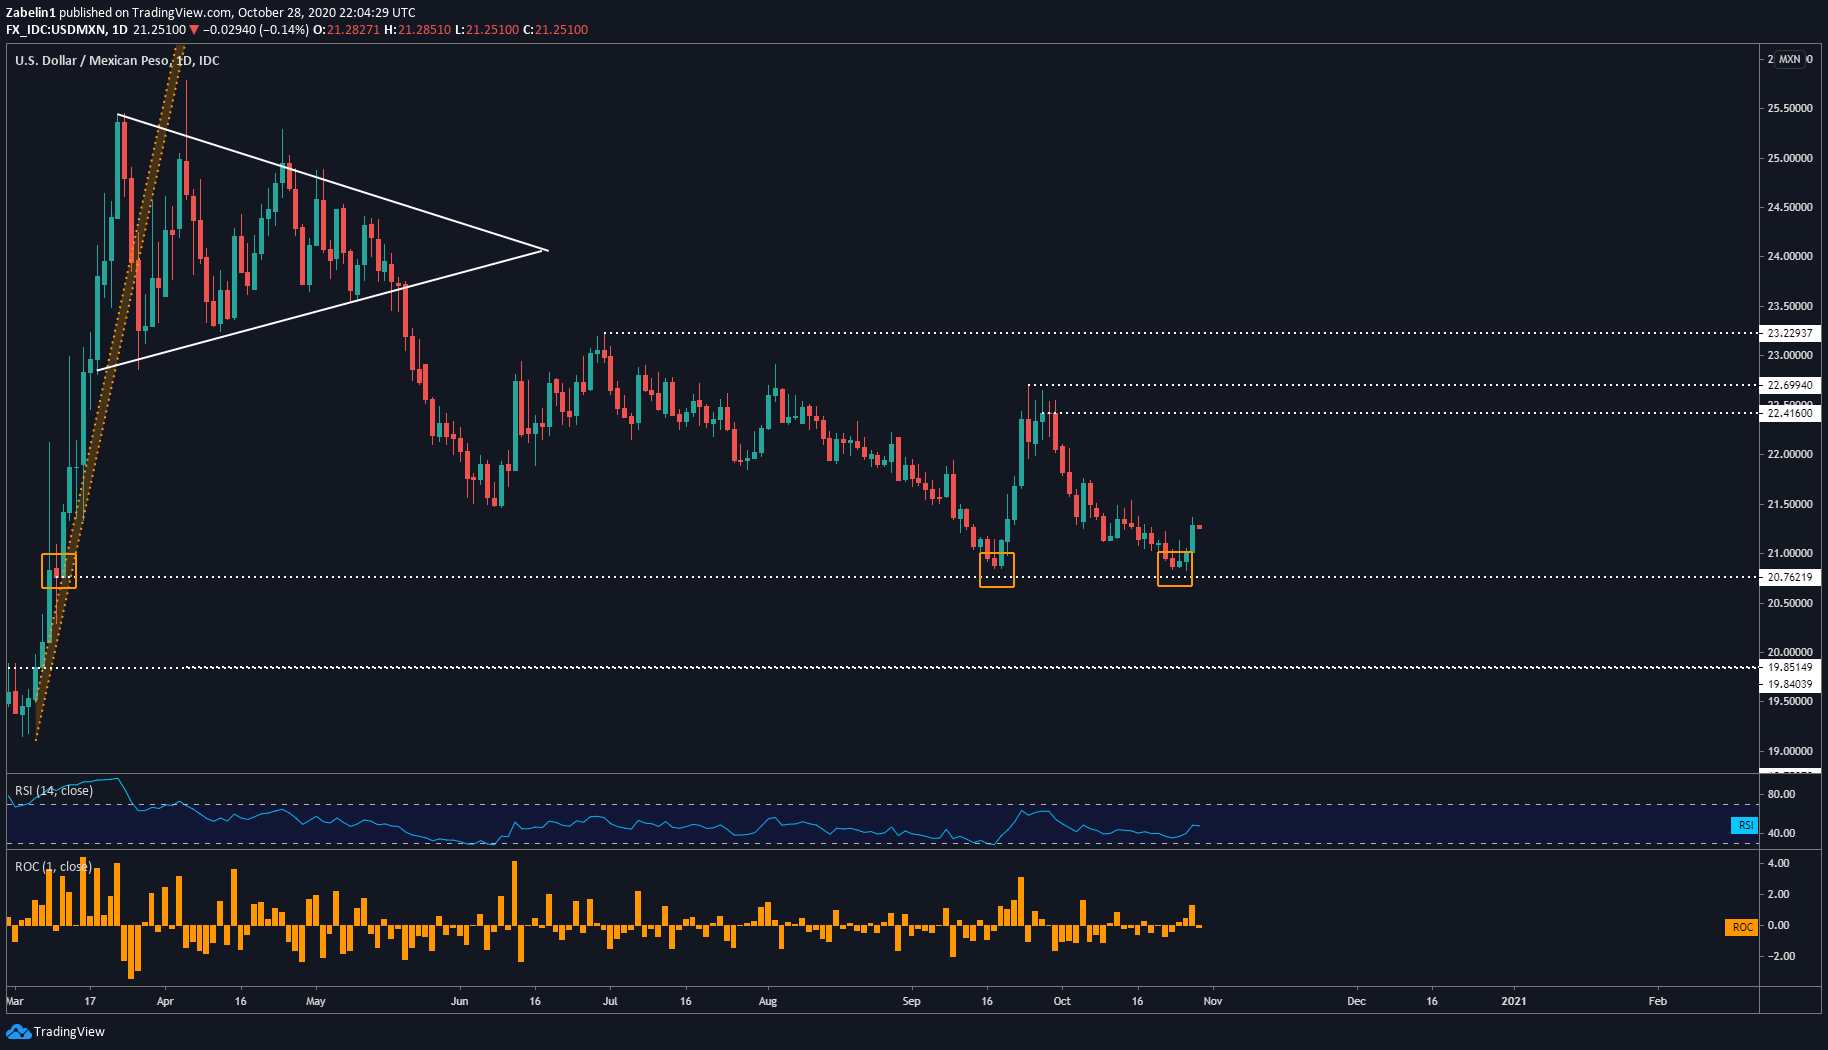
USD/MXN chart created using TradingView
Looking ahead, if buying pressure remains strong, the pair may retest the previous multi-week swings-highs at 22.4160 and 22.6994, respectively. At these levels, gains may be capped or if resistance here is broken, it could signal an underlying bullish bias that may be reinforced by the invalidation of those obstacles.

USD/KRW Outlook
USD/KRW has broken below what looks like a key inflection point at 1142.00, a price point that capped the pair’s gains in October and April of 2019. The break below it now with follow-through could mean challenging frequently-tested support at 1115.70. If it holds, what may follow is a congestive period of indecision where USD/KRW will bounce between it and the layer at 1115.70.
USD/KRW - Weekly Chart
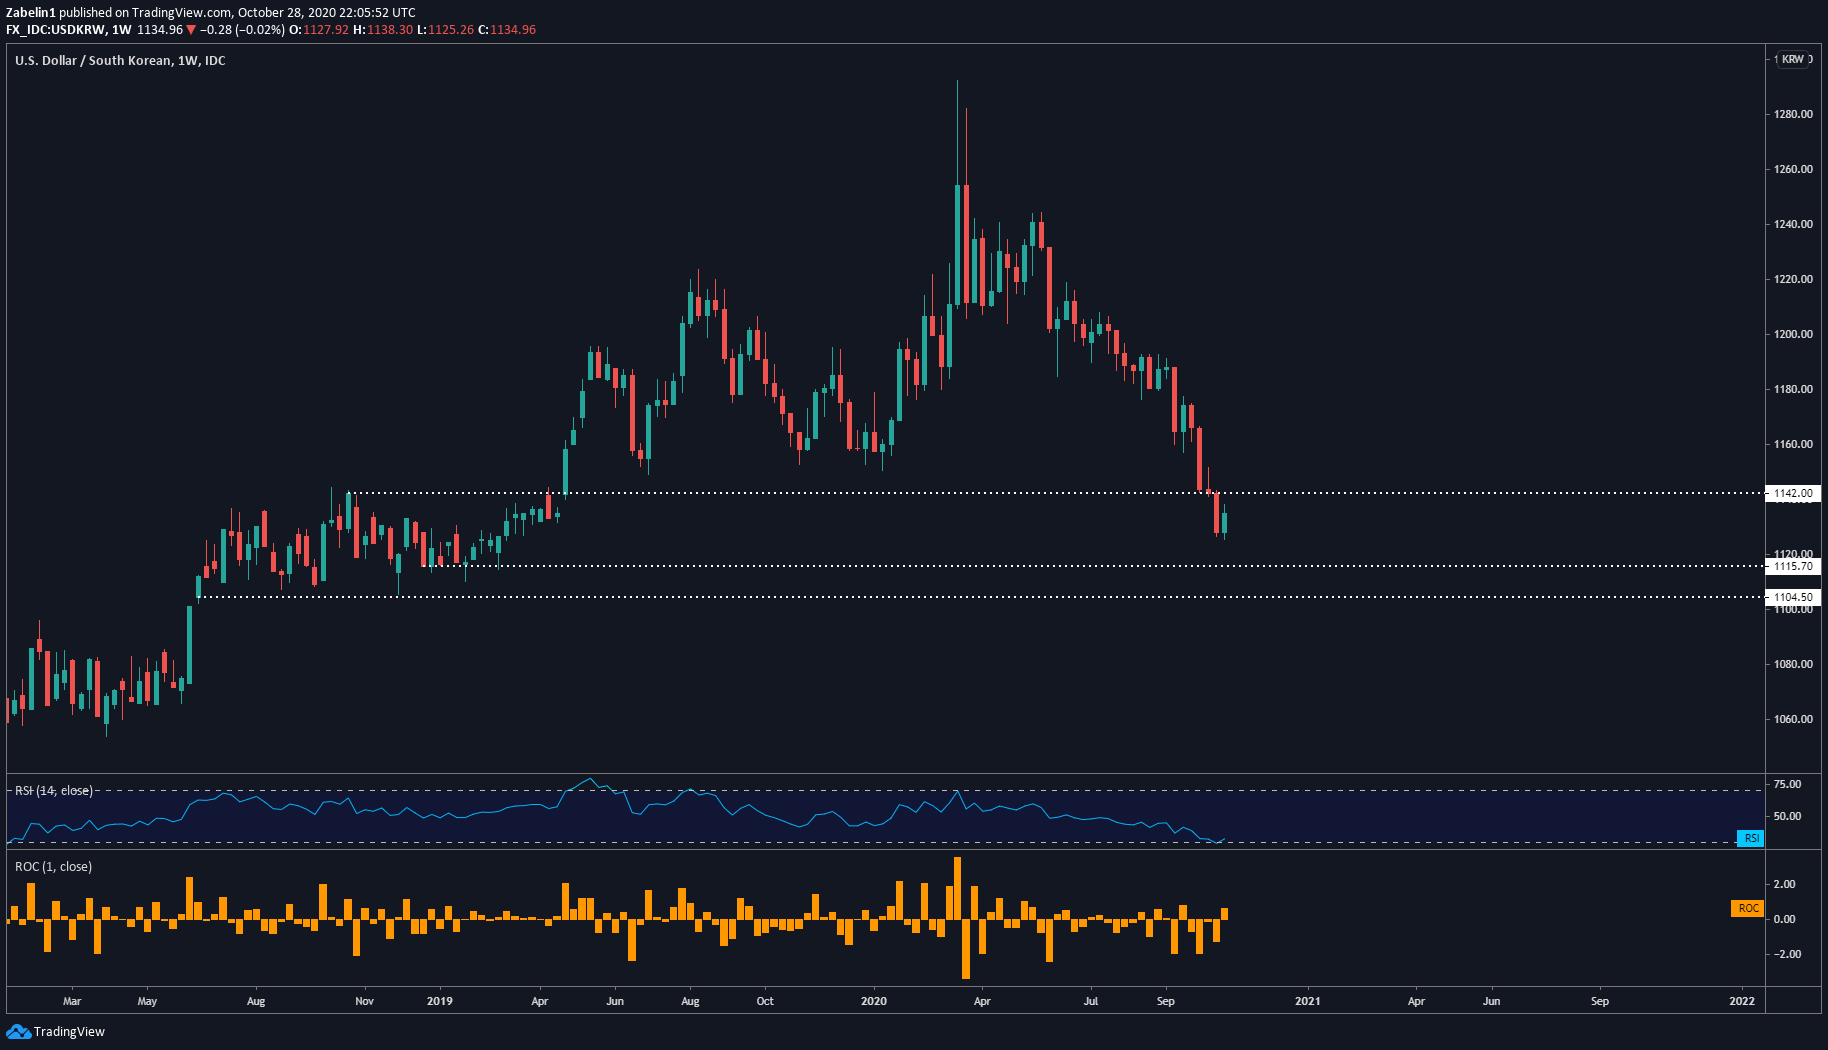
USD/KRW chart created using TradingView
Having said that, the fundamental fluidity of the current situation – 2020 US presidential election and Covid-19 – means significant bouts of volatility may spontaneously erupt. As a result, technical levels may have trouble holding or could be invalidated quicker than expected. For more nuanced technical analysis, be sure to follow me on Twitter @ZabelinDimitri.
USD/ZAR Forecast
USD/ZAR has been trading under the guidance of steep descending resistance after topping in March amid the selloff in risk-oriented assets. However, the pair is now trading in a critical juncture between stubborn support at 1115.70 and the increasingly-narrowing area between it and the slope of depreciation. With these kinds of setups I have come to call them “compression zones”.
USD/ZAR- Weekly Chart

USD/ZAR chart created using TradingView
If support holds and USD/ZAR subsequently bursts out of descending resistance, it could signal an underlying bullish bias. In that scenario, the pair may rise but gains may get capped at resistance at 17.1186. However, if the slope of depreciation holds and support is broken, the next floor to be tested may be at 15.6622.
--- Written by Dimitri Zabelin, Currency Analyst for DailyFX.com
To contact Dimitri, use the comments section below or @ZabelinDimitri on Twitter


