


US Dollar, USD/PHP, USD/SGD, USD/MYR, USD/PHP – ASEAN Technical Analysis
- USD/PHP attempting to climb through key trendline
- USD/SGD struggled around familiar support range
- USD/MYR may rise, USD/IDR still eyeing wedge
Philippine Peso Technical Outlook
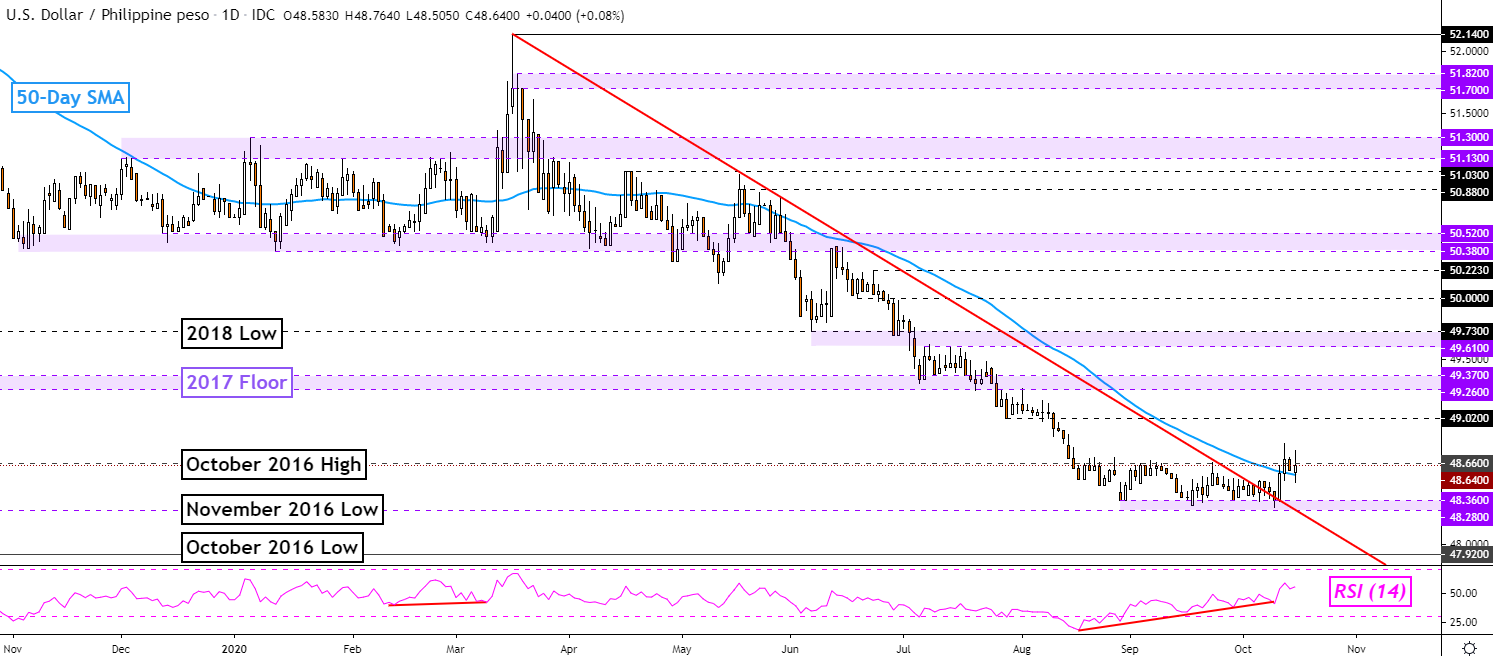
After much consolidation around its lowest price since late 2016, the US Dollar is attempting to push higher against the Philippine Peso. USD/PHP took out a falling trendline going back to March – red line on the daily chart below. This follows fading downside momentum, as indicated by positive RSI divergence. However, the pair was unable to then breach the October 2016 high at 48.66 which is acting as an inflection point.
The 50-day Simple Moving Average (SMA) is also proving difficult to push above, acting as key resistance. As such, confirmation of an upside breakout seems lacking. Further gains places the focus on 49.02 before testing the 2017 floor. Downtrend resumption may see USD/PHP retest October 2016 lows should the pair manage to clear the 48.28 – 48.36 support zone.

USD/PHP Daily Chart
USD/PHP Chart Created in TradingView
Singapore Dollar Technical Outlook
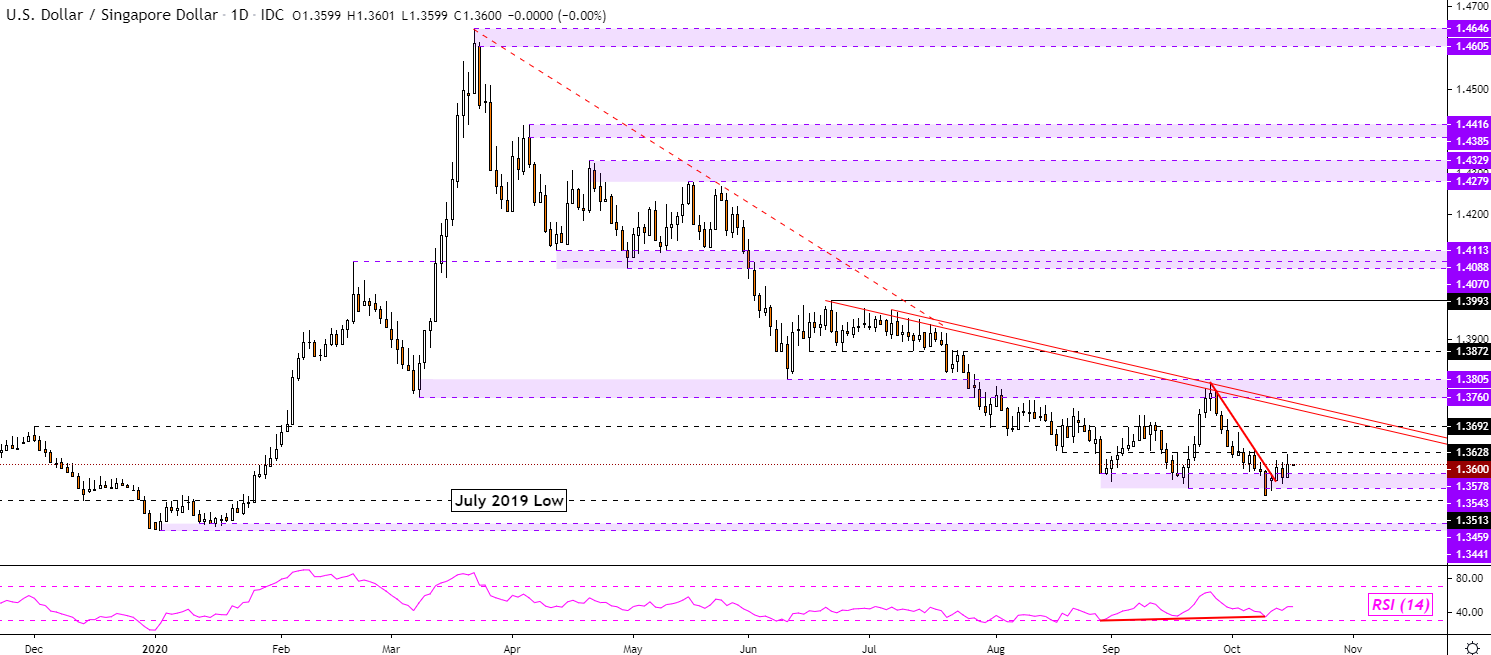
The Singapore Dollar is struggling to gain ground against the US Dollar as it struggles to clear the familiar 1.3543 – 1.3578 support zone. Now, USD/SGD is appearing to push above a short-term falling trendline from late September. This also follows positive RSI divergence, indicating fading downside momentum which can at times precede a turn higher.
If USD/SGD climbs above the 1.3628 inflection point, this could open the door to facing falling resistance from June. This could reinstate the focus to the downside. Beyond that area of falling resistance sits the 1.3760 – 1.3805 inflection zone. Subsequently climbing above this area could pave the way for further gains. Otherwise, clearing immediate support exposes January 2020 lows.

USD/SGD Daily Chart
USD/SGD Chart Created in TradingView
Malaysian Ringgit Technical Outlook
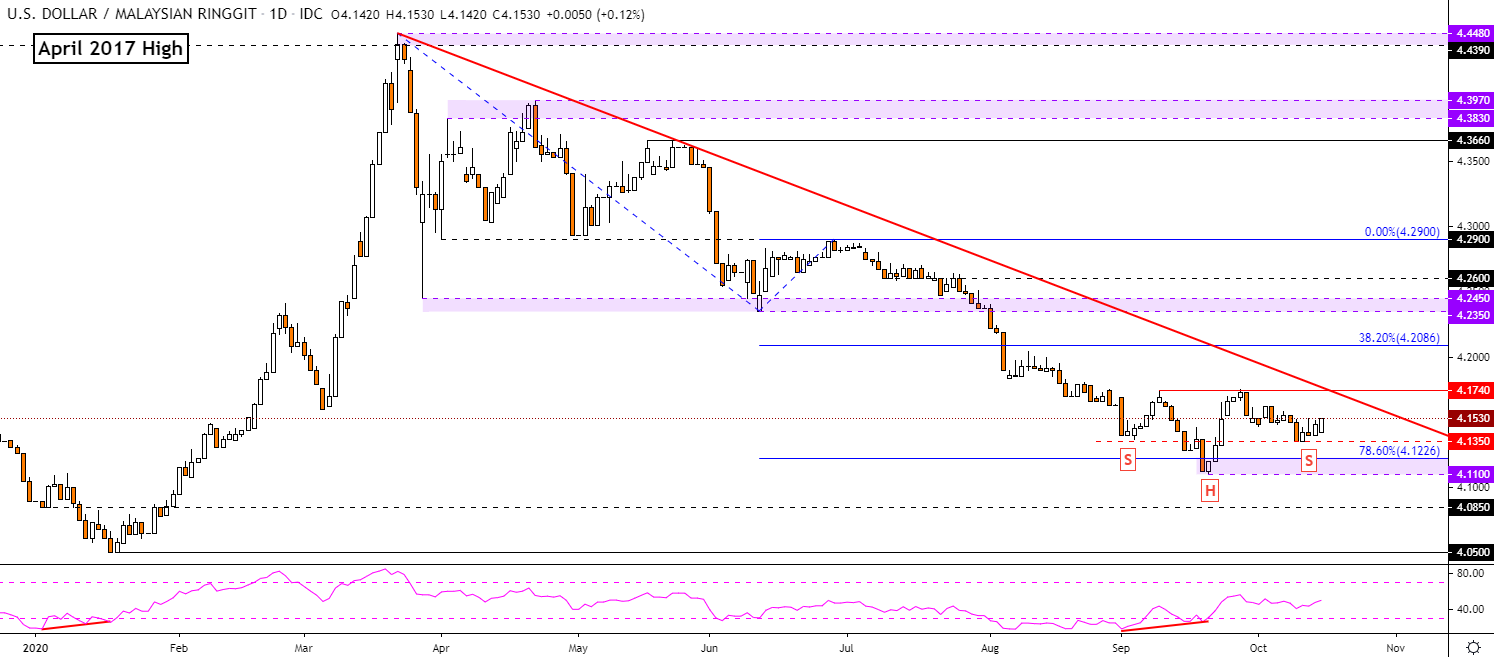
The US Dollar continues to consolidate against the Malaysian Ringgit with prices idling around familiar levels seen in late August. Since then, USD/MYR appears to be forming a bullish Head and Shoulders formation. A close above the neckline, around 4.1740, could open the door to extending a climb towards the 4.2350 – 4.2450 former support zone. It could establish itself as new resistance.
Along the way however, keep a close eye on the falling trend line from late March. This could reinstate the pair’s trajectory to the downside. Resuming the dominant downtrend since earlier this year entails a drop through key support, a range between 4.1100 and 4.1226. Clearing this zone exposes 4.0850 along the way towards the January 2020 low at 4.05.

USD/MYR Daily Chart
USD/MYR Chart Created in TradingView
Indonesian Rupiah Technical Outlook
The Indonesian Rupiah has been making cautious gains against the US Dollar since late September. On the whole, USD/IDR has been in a consolidative state since the middle of July. The pair bottomed in June, climbing before stalling and establishing a critical zone of resistance between 14915 and 14975. A climb above this range opens the door to uptrend resumption towards 2018 highs.
USD/IDR did fall under a bearish Rising Wedge in early October. However, downside confirmation has been somewhat lacking. Prices were also hovering around the 50-day SMA. Further losses from here would place the focus on the 14525 – 14563 inflection zone. Taking this out exposes what may be support at 14342 before potentially testing the June low.
For updates on ASEAN currencies as they break key technical levels, be sure to follow me on Twitter @ddubrovskyFX.
USD/IDR Daily Chart
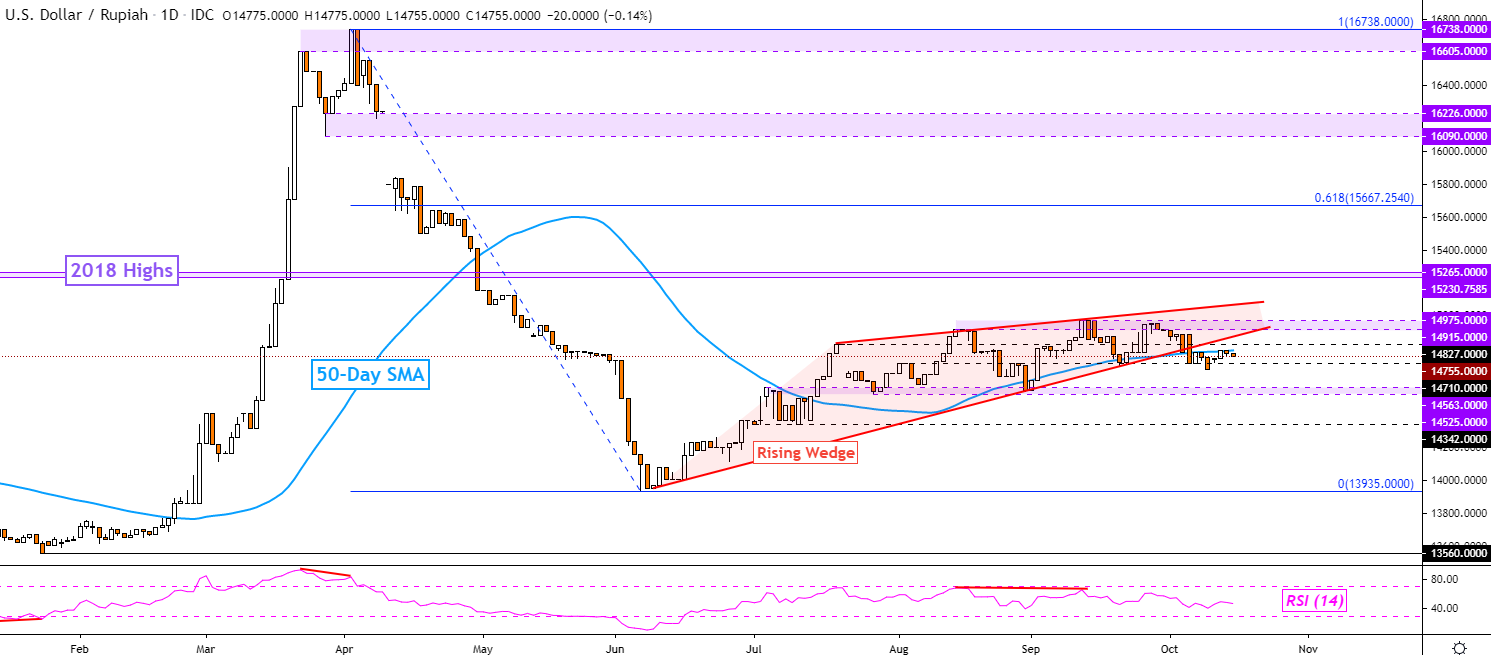
USD/IDR Chart Created in TradingView
--- Written by Daniel Dubrovsky, Currency Analyst for DailyFX.com
To contact Daniel, use the comments section below or @ddubrovskyFX on Twitter


