


Technical Outlook:
- USD/JPY to keep filling out wedge formation
- Gold price arriving at a potential inflection point
- DAX 30 H&S formation getting closer to possible trigger
USD/JPY looks poised to continue filling out a wedge formation with the help of some more weakness. It came off the top-side of the developing pattern just last week. A drop down to near 10400 would further along its potential for becoming an explosive pattern. The coiling nature of price over time typically leads to a sizable move, something that feels like we haven’t seen in forever out of USD/JPY. A break above 10610 would negate this developing outlook and have the channel line from February in play along with the 200-day at 10735.
USD/JPY Daily Chart (could continue filling out wedge)

Gold could be curling up and about to break higher, or meandering before taking another leg lower. There are a couple of signposts we can use to help determine which scenario is most probable to play out. There is a channel building off the September low that if broken to the downside looks likely to lead to selling within the context of a continuing corrective sequence of a bull market. On the flipside, there is a trend-line with multiple inflection points running off a peak created in August. If this is broken along with the 1933 level, we could see the end of the correction turn into another leg higher towards the record high at 2075.

Gold 4-hr Chart (channel meets trend-line)

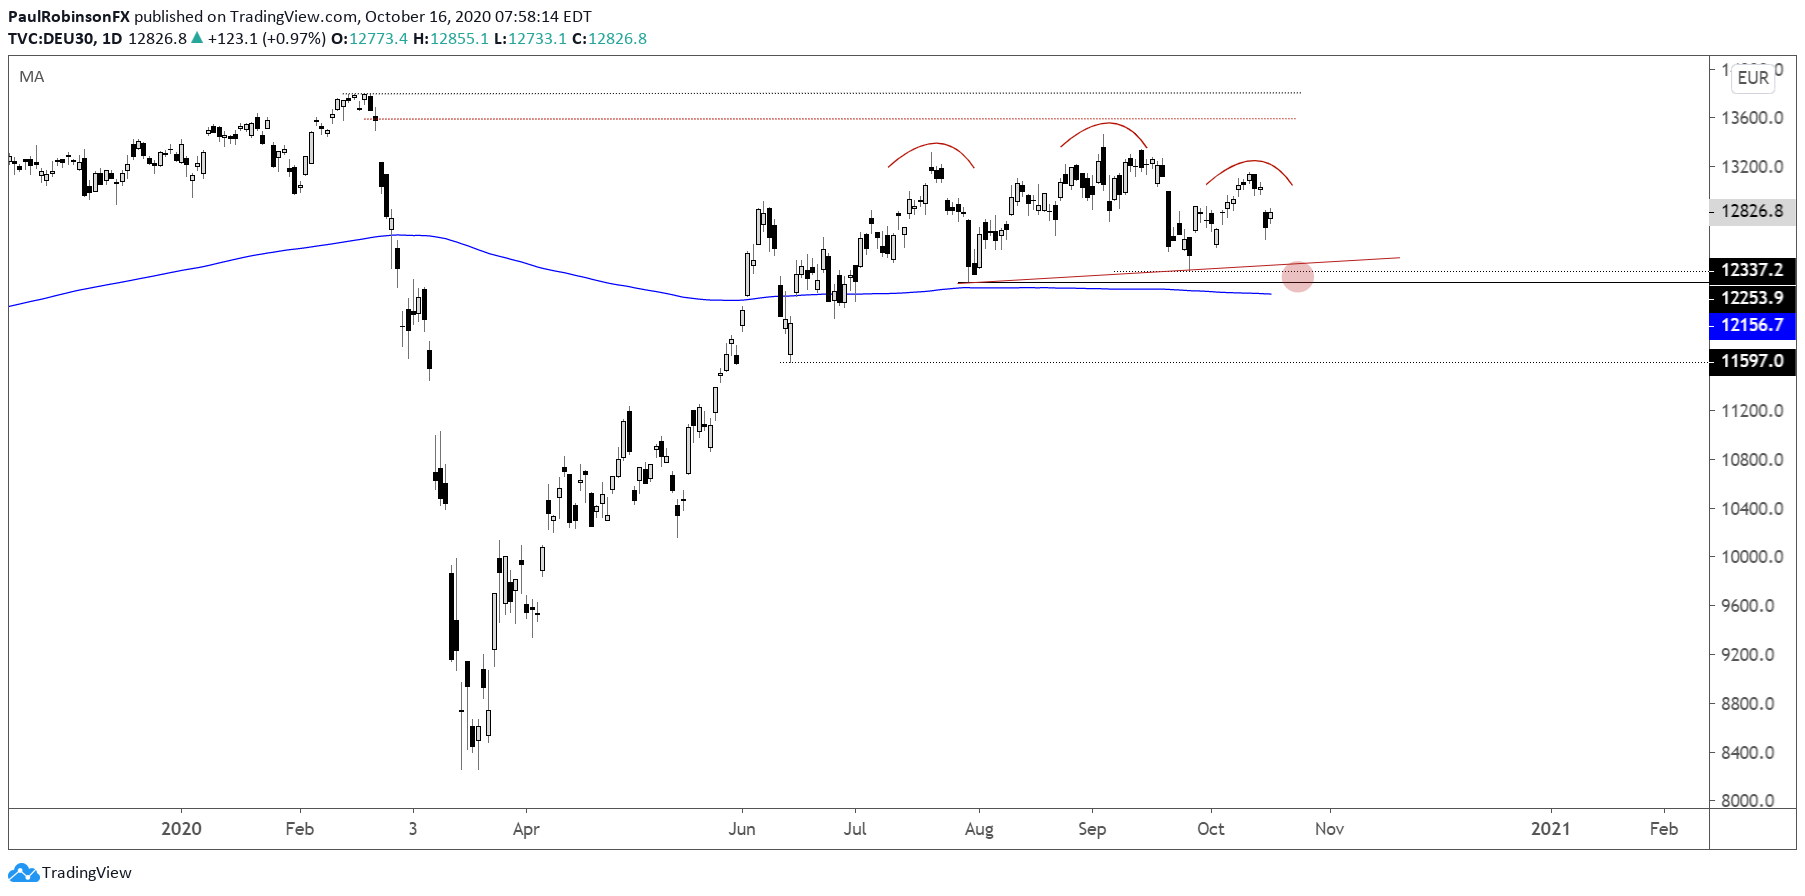
The DAX 30 is continuing to work on building a head-and-shoulders (H&S) formation. It has yet to confirm as a valid pattern, but if this week’s high holds we may have the right shoulder, which would leave the breaking of the neckline as the final portion of the equation. It is a big “if” still, but a possibility in the coming days/weeks. A breaking of the neckline and 200-day at 12156 is seen as leading to a meaningful decline that will likely be accompanied by a broader global risk-off situation.

DAX 30 Daily Chart (H&S still forming…)
Resources for Forex Traders
Whether you are a new or an experienced trader, DailyFX has several resources available to help you; indicator for tracking trader sentiment, quarterly trading forecasts, analytical and educational webinars held daily, and trading guides to help you improve trading performance.
---Written by Paul Robinson, Market Analyst
You can follow Paul on Twitter at @PaulRobinsonFX


