


Dow Jones, S&P 500, DAX 30, IGCS, Trader Positioning - Talking Points
- Trump pours cold water on US fiscal stimulus hopes, sending equities lower
- IG Client Sentiment may offer bearish signals in stocks as long bets increase
- What are the technical barriers the Dow Jones, S&P 500 and DAX 30 face?
On Tuesday, US President Donald Trump inspired risk aversion throughout financial markets as he abruptly called off talks for a second fiscal package until after November’s presidential election. The Dow Jones Industrial Average, S&P 500 and Nasdaq Composite closed -1.34%, -1.40% and -1.57% respectively.
If equities extend losses on rising political and stimulus woes, this could inspire retail investors to chase relatively cheaper stocks. That would consequentially increase upside exposure. This may be depicted via IG Client Sentiment (IGCS) in the short run. IGCS is a contrarian indicator, so what could this mean ahead?

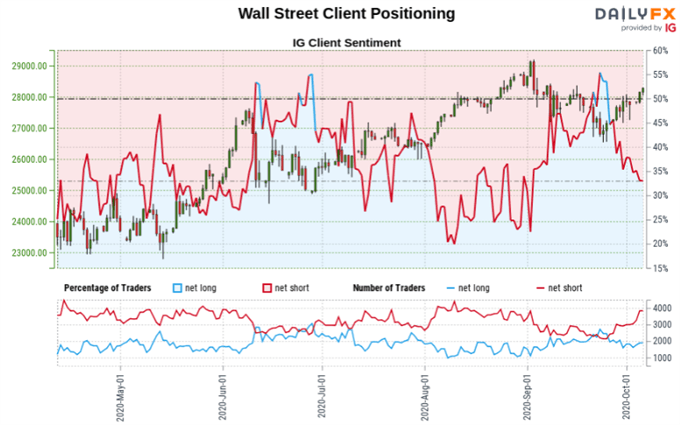
Dow Jones Sentiment Outlook - Bullish
For the time being, the IGCS gauge implies that 30.75% of retail investors are net long the Dow Jones. Net long bets have decreased by 4.5% and 24.7% over a daily and weekly basis respectively. The combination of current sentiment and recent changes offers a stronger bullish contrarian trading bias.

Dow Jones Futures Technical Analysis
The Dow Jones may still be at risk of a turn lower after the near-term 20-day Simple Moving Average (SMA) crossed under the medium-term 50-day SMA. This has created a bearish ‘Death Cross’ after prices stalled under the 28084 – 28197 inflection zone. Key support sits below between 26407 and 26658.
Dow Jones Futures – Daily Chart
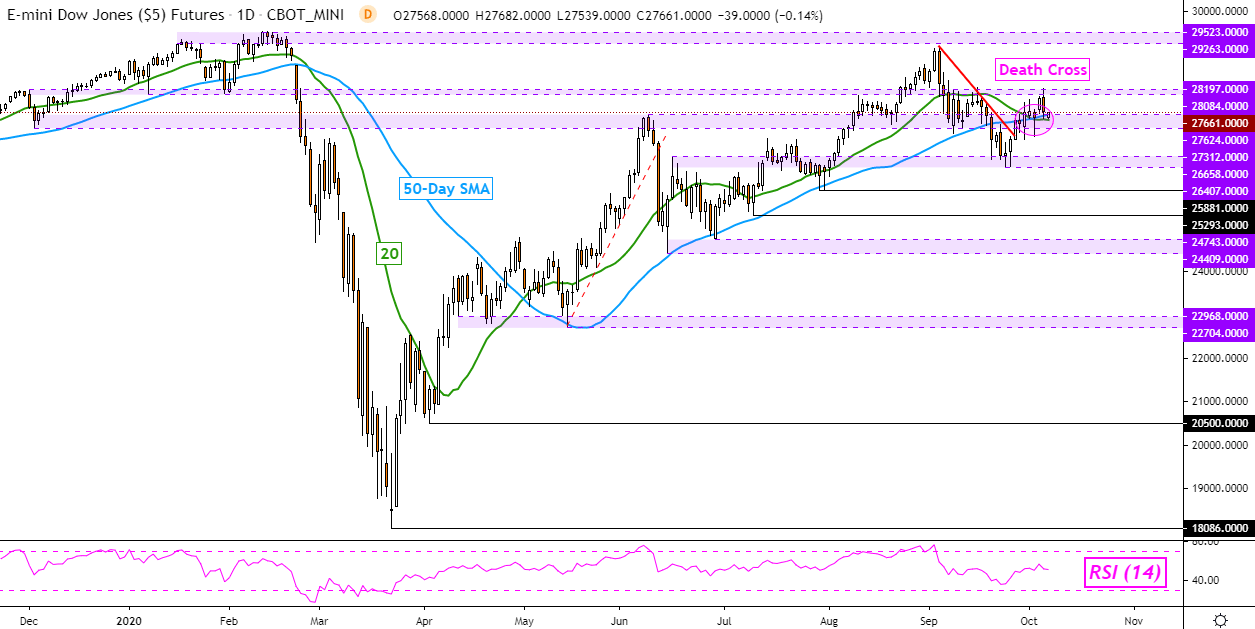
Dow Jones Chart Created in Trading View
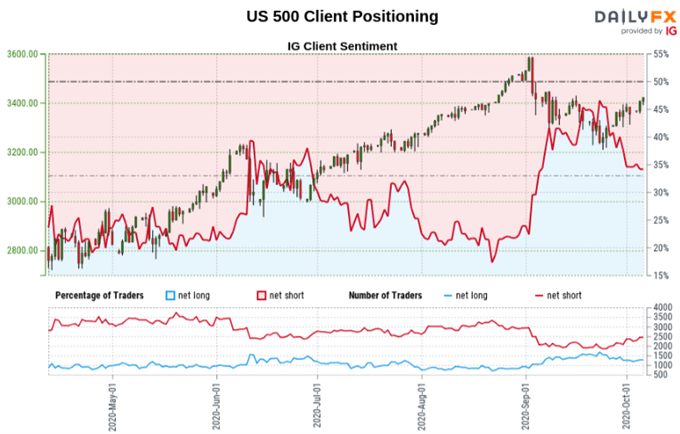
S&P 500 Sentiment Outlook - Mixed
The IGCS gauge implies that roughly 36% of retail traders are net long the S&P 500. Net long bets have increased by 10.69% over a daily basis as downside exposure declined by 6.38%. The combination of current sentiment and recent changes offers a mixed trading bias.
S&P 500 Technical Analysis
S&P 500 futures are also facing a bearish ’Death Cross’ after the 20-day SMA crossed under the 50-day SMA. This follows a rejection of the upper bound of the 3337.50 – 3397.50 inflection zone. Key support sits below as the 3213 – 3231 inflection zone.
S&P 500 Futures – Daily Chart
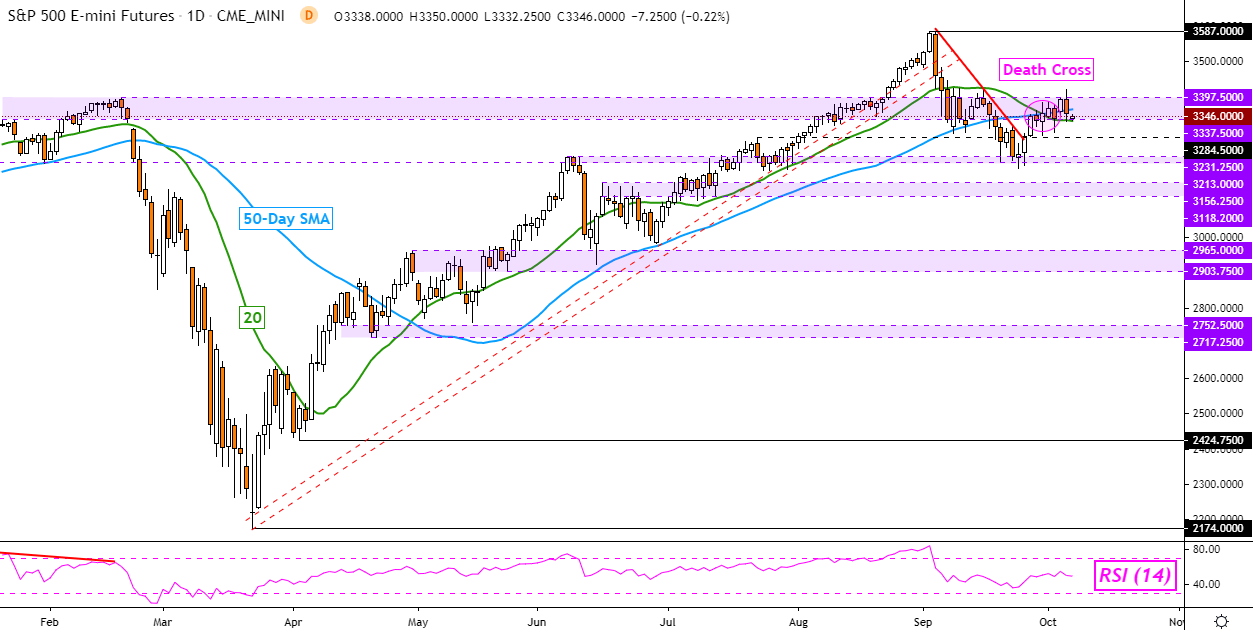
S&P 500 Chart Created in Trading View
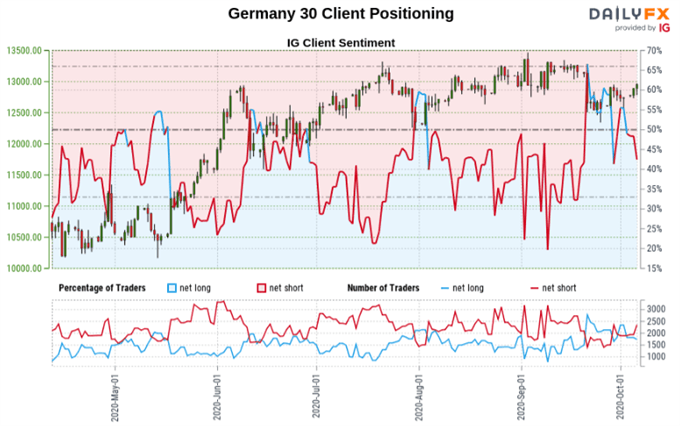
DAX 30 Sentiment Outlook - Bullish
The IGCS gauge implies that about 36.77% of retail investors are net long Germany’s benchmark stock index, the DAX 30. Net long bets have decreased by 21.74% and 11.65% over a daily and weekly basis respectively. The combination of current sentiment and recent changes offers a strongerbullish contrarian trading bias.
Follow me on Twitter @ddubrovskyFX for updates on price trends and retail positioning!
DAX 30 Technical Analysis
DAX 30 futures recently rejected the 12882 inflection point. The index could be at risk of a turn lower following the breakout under a bearish Rising Wedge. That would leave prices facing key support which is a range between 12199 and 12336. A push higher exposes the floor of the wedge as potential resistance.
DAX 30 – Daily Chart
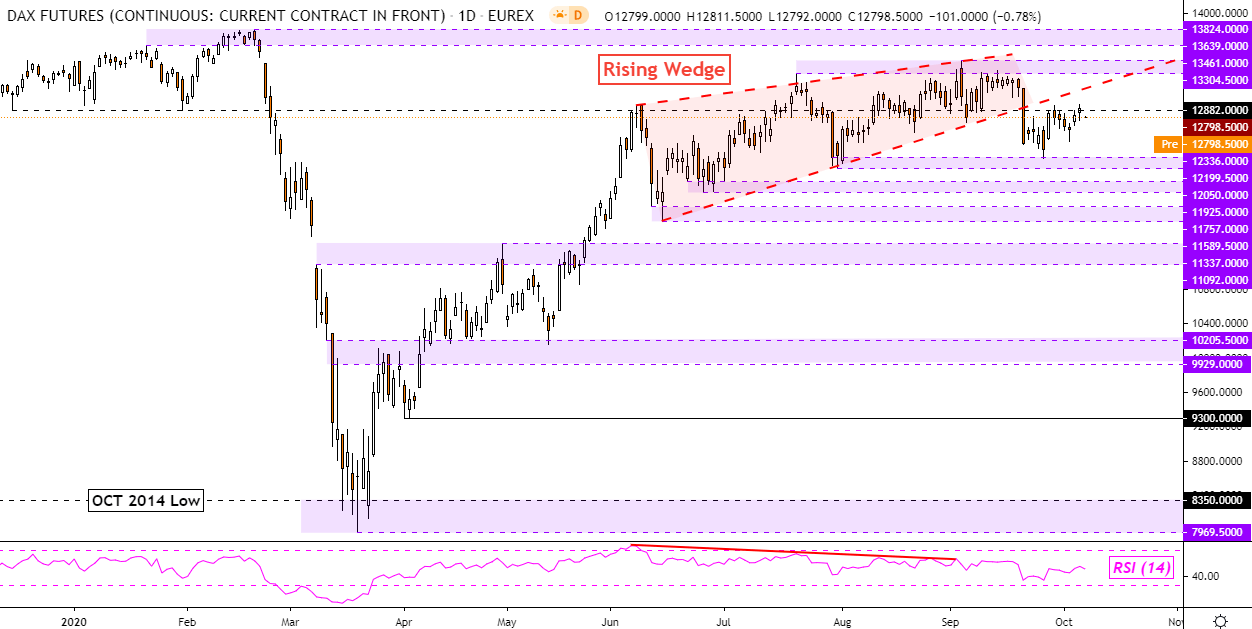
DAX Chart Created in Trading View
*IG Client Sentiment Charts and Positioning Data Used from October 6th Report
--- Written by Daniel Dubrovsky, Currency Analyst for DailyFX.com
To contact Daniel, use the comments section below or @ddubrovskyFX on Twitter


