


USD/MXN Highlights:
- USD/MXN wedge formation to lead to a breakout
- Trend-line on top-side, price support on the bottom-side
USD/MXN wedge formation to lead to a breakout
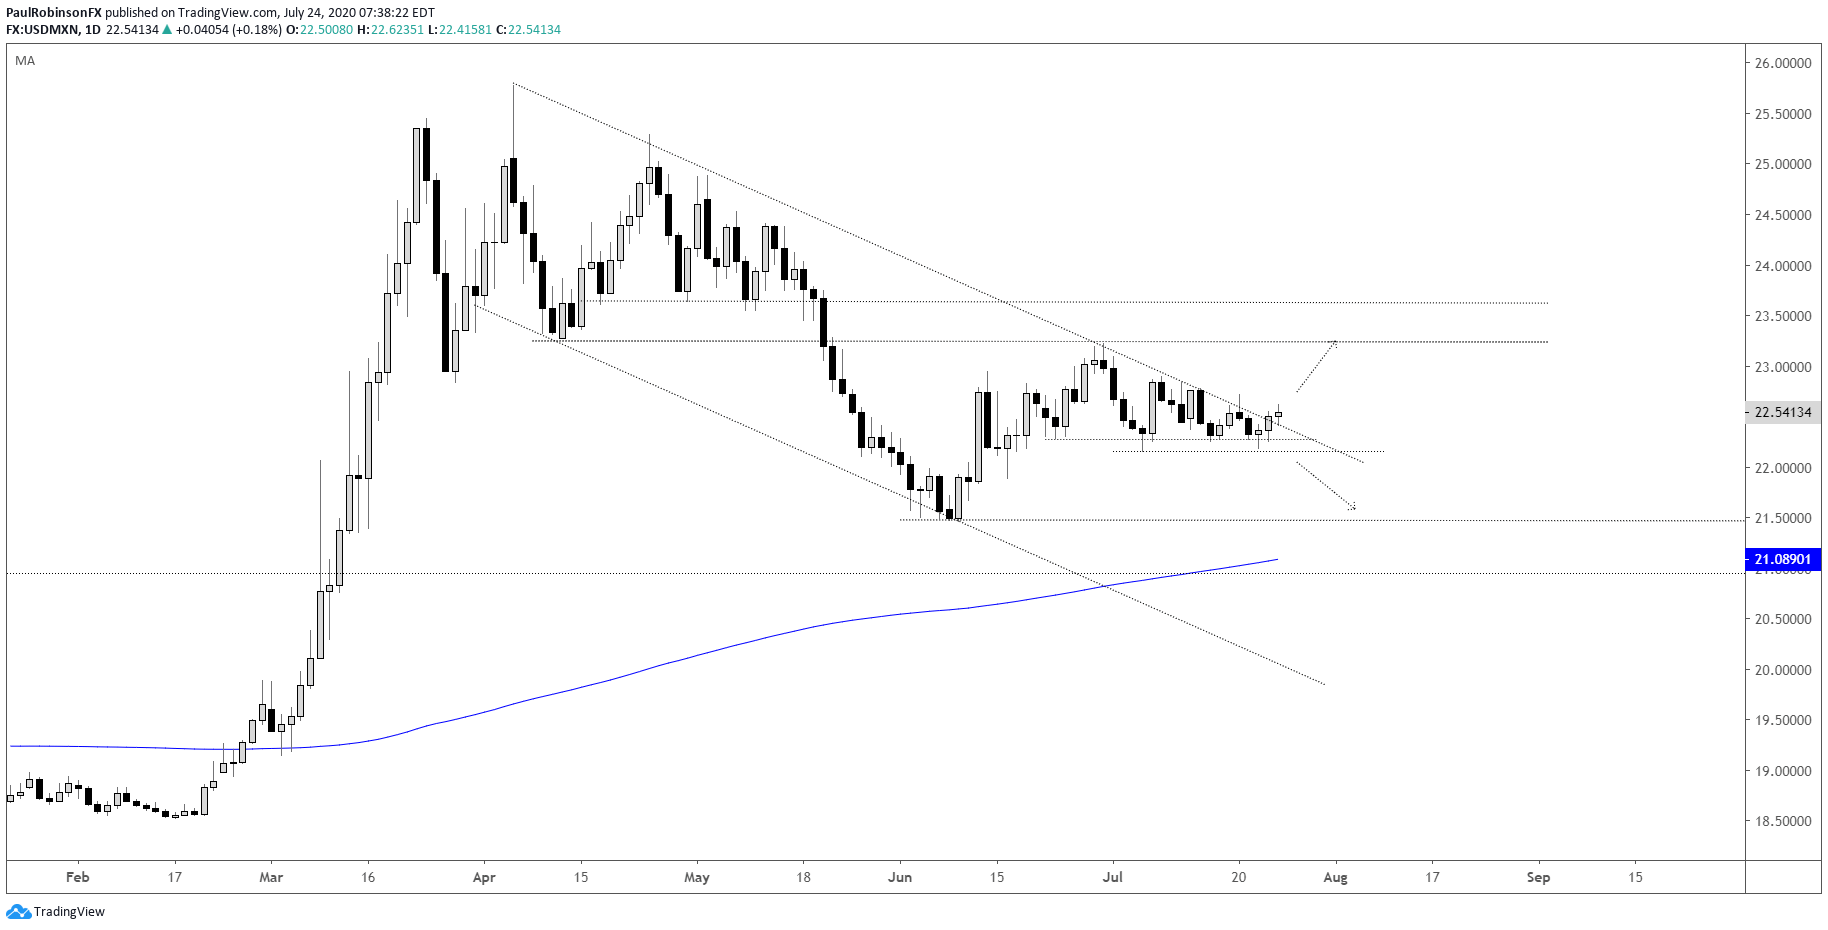
USD/MXN has been coiling up for the duration of the month as it finds little to sway it in either direction, but that is set to change as the descending wedge is near its breaking point. Should we see a resolution higher, then the trend-line off the April spike-high will need to be broken.
In the event of a bullish break the first targeted area of resistance comes in around 23.20, where a low pivot from April and high pivot from June come in. Beyond there another area of resistance resides around 23.60.
We could see further upside beyond those levels, but those would be the first set of challenges for the pair. To really boost USD higher vs EM currencies it is likely a risk-off environment will be needed.
Looking lower, there is a solid floor around 22.30/15 that has kept the wedge building. A breakdown below support would be in-line with the general trend off the April high, and position USD/MXN for a test of the June low at 21.46 and the 200-day MA at 21.08.
All-in-all, a breakout is in the works and should have a move developing that traders can latch on to. One thing to beware of with these types of formations is the potential for an initial false break in one direction that results in a reversal in the sustainable direction. These can end up as causing even larger moves as the market is effectively caught leaning the wrong way on the false break.

USD/MXN Daily Chart (wedge pattern to break)
Resources for Forex Traders
Whether you are a new or experienced trader, we have several resources available to help you; indicator for tracking trader sentiment, quarterly trading forecasts, analytical and educational webinars held daily, trading guides to help you improve trading performance, and one specifically for those who are new to forex.
---Written by Paul Robinson, Market Analyst
You can follow Paul on Twitter at @PaulRobinsonFX


