


US Dollar, USD/SGD, USD/IDR, USD/PHP, USD/MYR – ASEAN Technical Analysis
- USD/SGD may bounce but falling resistance may keep downtrend intact
- USD/IDR could rise after Golden Cross, be wary of Bank of Indonesia
- USD/PHP may bottom on reversal signals, USD/MYR eyes support next
Singapore Dollar Technical Outlook
The US Dollar may attempt a push higher against the Singapore Dollar after USD/SGD was unable to break under lows from June. This area makes for a key zone of support between 1.3805 and 1.3820. However, gains may be contained by the medium-term falling trend line from March’s top. This could reinstate the focus to the downside. If that leads to a break under June lows, USD/SGD may accelerate lower towards the March low. Further declines place the focus on the 78.6% Fibonacci retracement at 1.3699.

USD/SGD Daily Chart
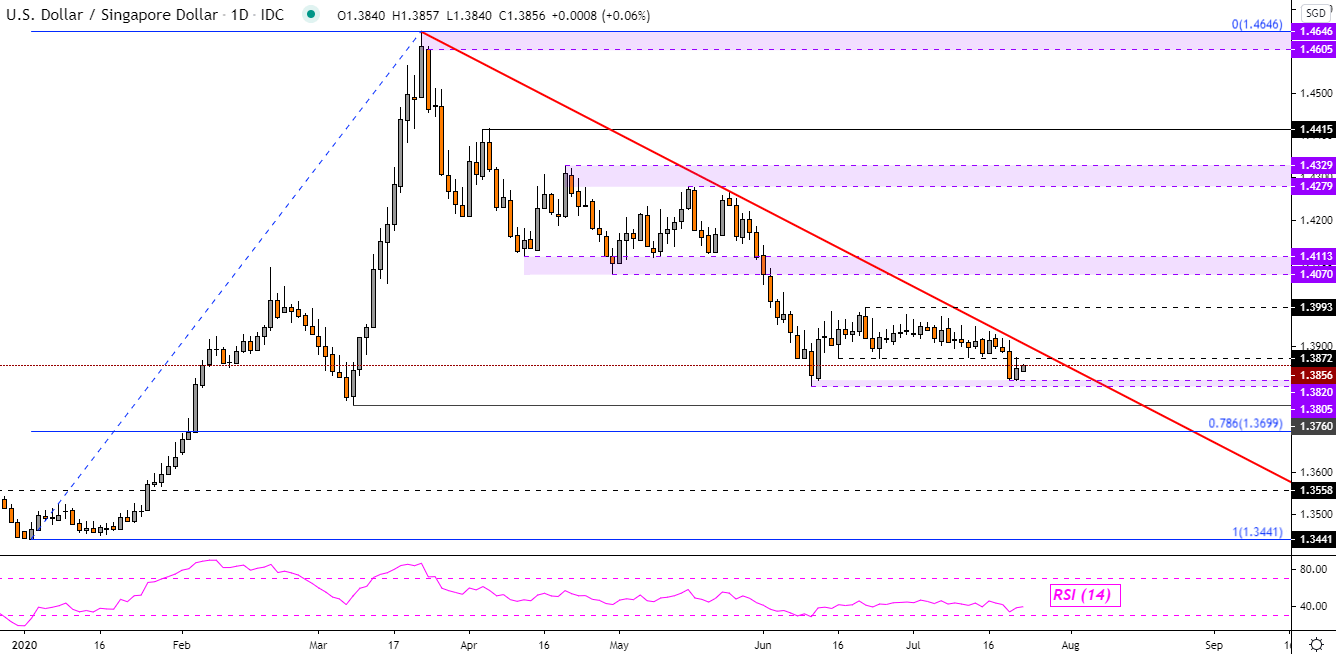
USD/SGD Chart Created in TradingView
Indonesian Rupiah Technical Outlook
The US Dollar may resume gains against the Indonesian Rupiah after USD/IDR established new resistance at 14827 and turned lower. That is because the short-term 20-Day Simple Moving Average (SMA) crossed above the medium-term 50-Day SMA. In technical analysis, this is known as a Golden Cross which is typically a bullish signal. Do keep in mind that the Bank of Indonesia is leery of weakness in the Rupiah and may step in to contain depreciation in its currency. A close under 14342 may reinstate the focus to the downside.

USD/IDR Daily Chart
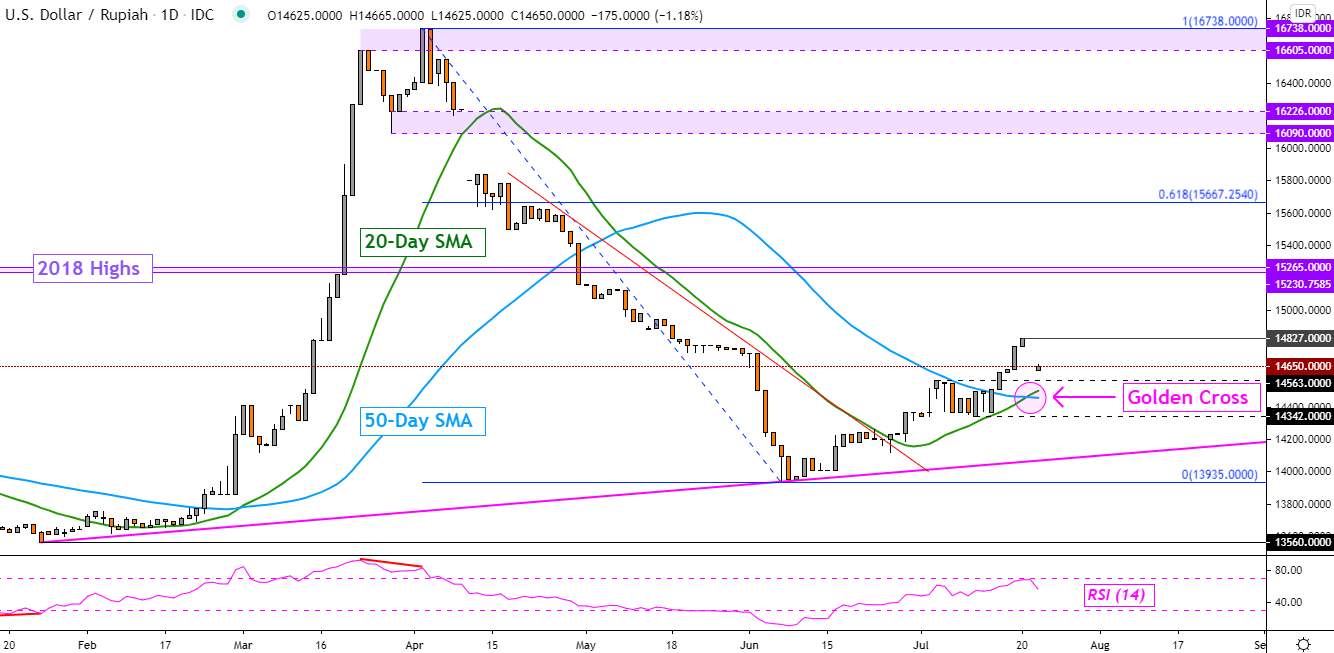
USD/IDR Chart Created in TradingView
Philippine Peso Technical Outlook
The US Dollar may rise against the Philippine Peso as USD/PHP was once again unable to breach the 2017 floor between 49.26 – 49.37. Prices have left behind a Doji candlestick, which is a sign of indecision. Since then, there has been cautious upside progress, potentially confirming the predictive nature of the Doji. Furthermore, positive RSI divergence shows that downside momentum is fading. Taking this into consideration, USD/PHP may pressure key falling resistance from March as well as the 20-day SMA.
Find your trading personality and optimal forms of analysis
USD/PHP Daily Chart
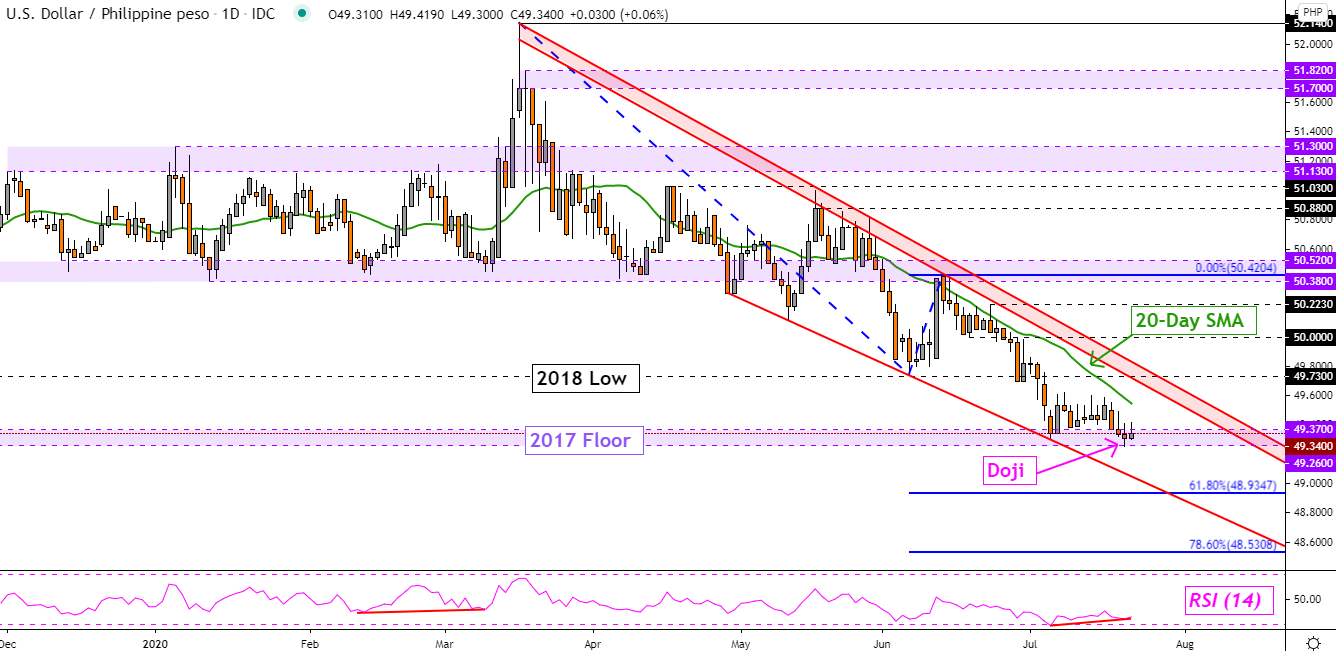
USD/PHP Chart Created in TradingView
Malaysian Ringgit Technical Outlook
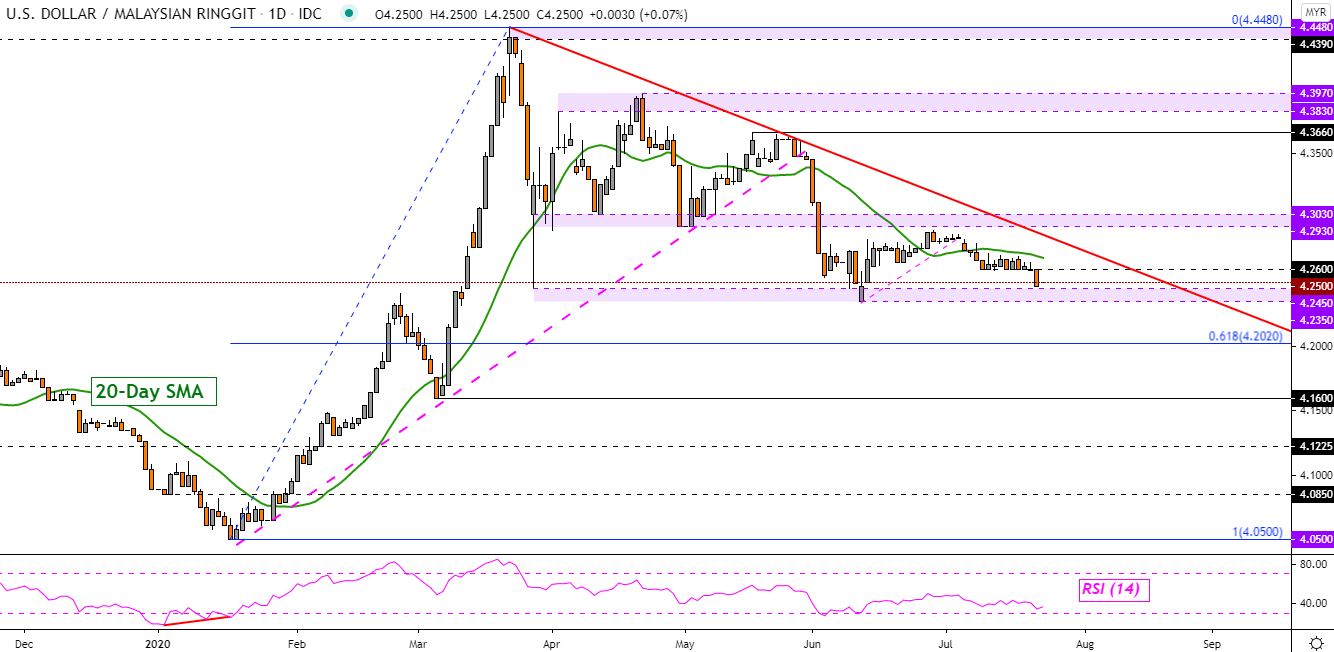
The US Dollar is under pressure against the Malaysian Ringgit as USD/MYR approaches key support which is a range between 4.2350 and 4.2450. Prices just took out 4.26 which was helping to prevent deeper losses for most of this month. Helping to keep the focus to the downside is the 20-day SMA. If key support holds here and precedes a bounce, the falling trend line from March could reinstate the focus back to the downside and potentially establish a Descending Triangle chart pattern. The latter is a continuation formation.
USD/MYR Daily Chart
--- Written by Daniel Dubrovsky, Currency Analyst for DailyFX.com
To contact Daniel, use the comments section below or @ddubrovskyFX on Twitter


