USD vs MXN Technical Forecast
- The safe-haven linked the US Dollar weakened despite the global increase in Coronavirus infections
- Bearish signals on USD vs MXN price chart await charge
USD/MXN – Recovered Losses
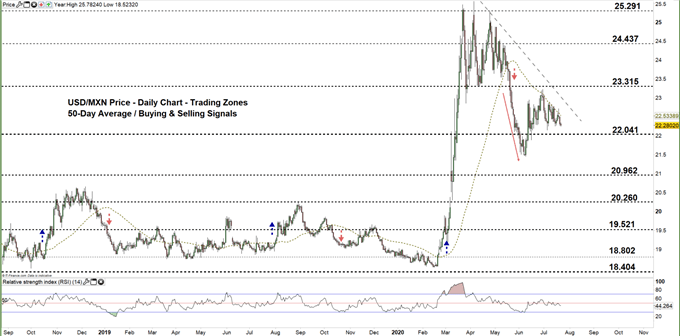
On Wednesday, USD/MXN declined to a one week low of 22.255 without committing to a new bear trend. Alongside that, the Relative Strength Index (RSI) remained near 50, reflecting a rather neutral setting for momentum.
Traders seemed to invest in riskier assets amid positive news about a coronavirus vaccine. Despite rising cases of Covid-19 in the US, the market mood remained bullish, pressuring the safe-haven linked US Dollar.
USD/MXN DAILY PRICE CHART (Sep 1, 2018 – JuLY 22, 2020) Zoomed Out


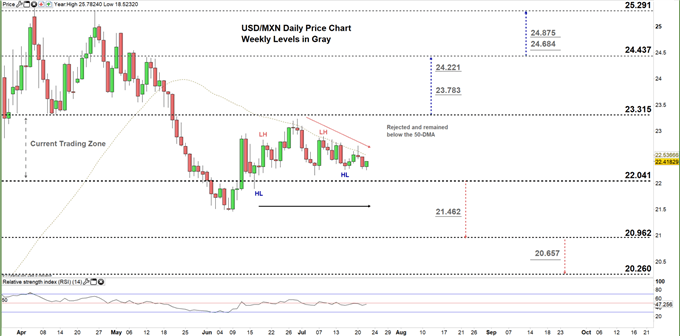
USD/MXN DAILY PRICE CHART (April 16 – JuLY 22, 2020) Zoomed In

In mid-June, USD/MXN began the climb into the current 22.041 – 23.315 trading zone, marked by the January 2017 top and former support from mid-April, respectively. It then started a sideways move, creating a set of lower highs and higher lows. Additionally, the price has failed on multiple occasions to close above the 50-day moving average, hinting at a lack of momentum to start an upside trend.
A close above the low end of the zone may guide USDMXN’s fall towards support at 20.962 (June 2018 high). A further close below that level could encourage bears to send the price towards the following support at 20.260 (December 2018 high).
On the flip-side, a close above the high end of the trading zone could ultimately start a rally towards the monthly resistance at 24.437, and a further close above that level may embolden bulls to revisit the April 24 high at 25.291.


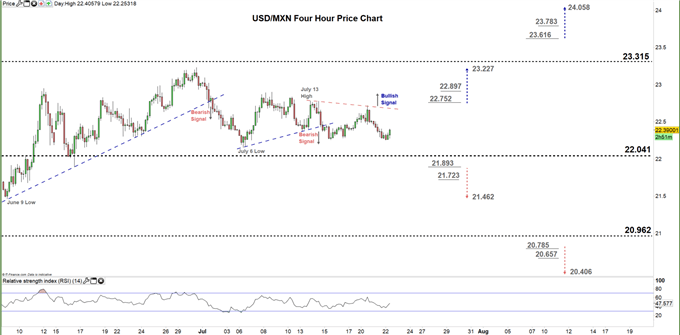
USD/MXN FOUR HOUR PRICE CHART (JUNE 6 – JULY 22, 2020)

Last week, USD/MXN traded below the bullish trendline support originating from the July 6 low at 22.154, signaling a possible start of a bearish move.
With that said, a break above the downside sloping trendline resistance originating from the July 13 high at 22.781 could keep the bullish potential alive.
To conclude, a break below the June 16 low at 21.893 could send USDMXN towards 21.462, while a break above 22.752 may trigger a rally towards 23.227. As such, the daily support and resistance levels underlined on the four-hour chart should be kept in focus.


Written By: Mahmoud Alkudsi
Please feel free to contact me on Twitter: @Malkudsi


