


AUD/USD, NZD/USD, S&P 500, Trader Positioning - Talking Points
- AUD/USD, NZD/USD, S&P 500 achieved key breakouts
- Australian Dollar may appreciate based on positioning
- The outlook for NZD/USD and S&P 500 points bearish
In financial markets, currencies like the growth-linked Australian and New Zealand Dollars recently achieved upside breakouts along with cautious gains in the S&P 500. In this week’s session on IG Client Sentiment (IGCS), I break down these movements. IGCS is typically viewed as a contrarian indicator. For a further in-depth analysis that branches into fundamental discussion, check out the recording of the session above.
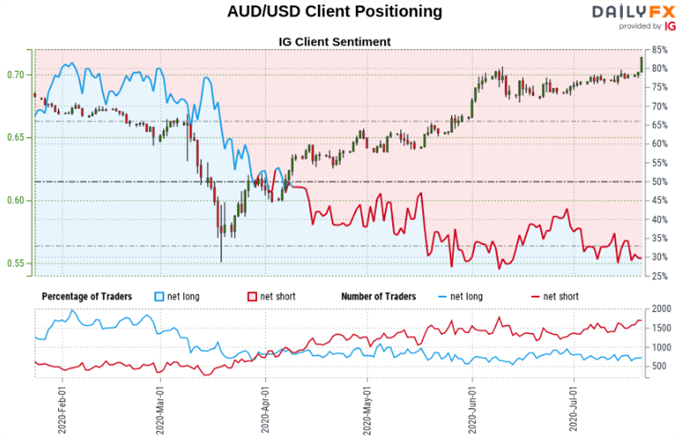
AUD/USD Sentiment Outlook - Bearish
The IGCS gauge implies that 28.90% of retail investors are net long AUD/USD. Upside exposure in this pair has decreased by 10.36% and 10.60% over a daily and weekly basis respectively. The combination of current sentiment and recent changes offers a stronger bullish contrarian trading bias. From a psychological standpoint, this could speak to a rising share of traders who perceive the price as too expensive.
Develop the discipline and objectivity you need to improve your approach to trading consistently
Australian Dollar Technical Analysis
AUD/USD surged past the key resistance range between 0.7015 – 0.7064, setting course to retest highs from 2019. This is arguably the most meaningful upside progress since early June as prices spent most of the past few weeks consolidating. Negative RSI divergence does show that upside momentum is fading, and that can at times precede a turn lower. In that event, keep an eye on the 20-Day Simple Moving Average (SMA) for support.

AUD/USD – Daily Chart

AUD/USD Chart Created in Trading View
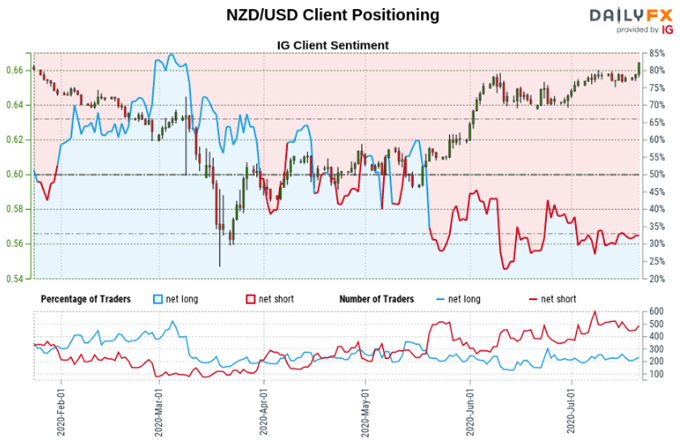
NZD/USD Sentiment Outlook - Bearish
The IGCS gauge implies that 43.45% of retail investors are net long NZD/USD. Upside exposure has increased by 16.24% and 19.82% over a daily and weekly basis respectively. Traders are also less net-short over the same periods. With that in mind, recent changes in sentiment warn that the current price trend may soon reverse lower.

New Zealand Dollar Technical Analysis
NZD/USD surged past the key resistance range between 0.6551 – 0.6585, pausing its rise on the 23.6% Fibonacci extension at 0.6644. This has exposed the December 31st high at 0.6756. Much like with AUD/USD, negative RSI divergence is present here which may precede a turn lower. If prices do retreat, the 20-day SMA sits below and may keep losses at bay.
NZD/USD – Daily Chart

NZD/USD Chart Created in Trading View
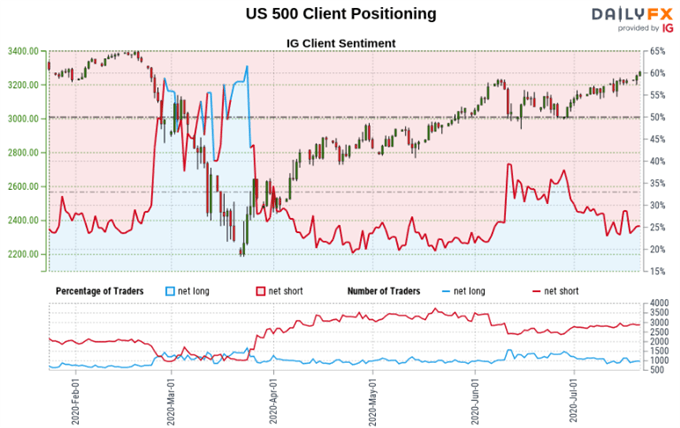
S&P 500 Sentiment Outlook - Bearish
The IG Client Sentiment (IGCS) implies that 27.99% of retail traders are net long the S&P 500. Net short bets have decreased by 9.63% and 2.30% over a daily and weekly basis respectively. Recent changes in sentiment warn that the current price trend may soon reverse lower despite the fact traders remain netshort.
S&P 500 Technical Analysis
S&P 500 futures recently took out highs from June, exposing the all-time peak at 3397. Tuesday’s candle does fit the parameters of a Shooting Star candlestick, a sign of indecision. A further upside close could invalidate it. Negative RSI divergence shows fading upside momentum. A turn lower places the focus on near term rising support from late June – red line on the daily chart below.
S&P 500 Futures - Daily Chart
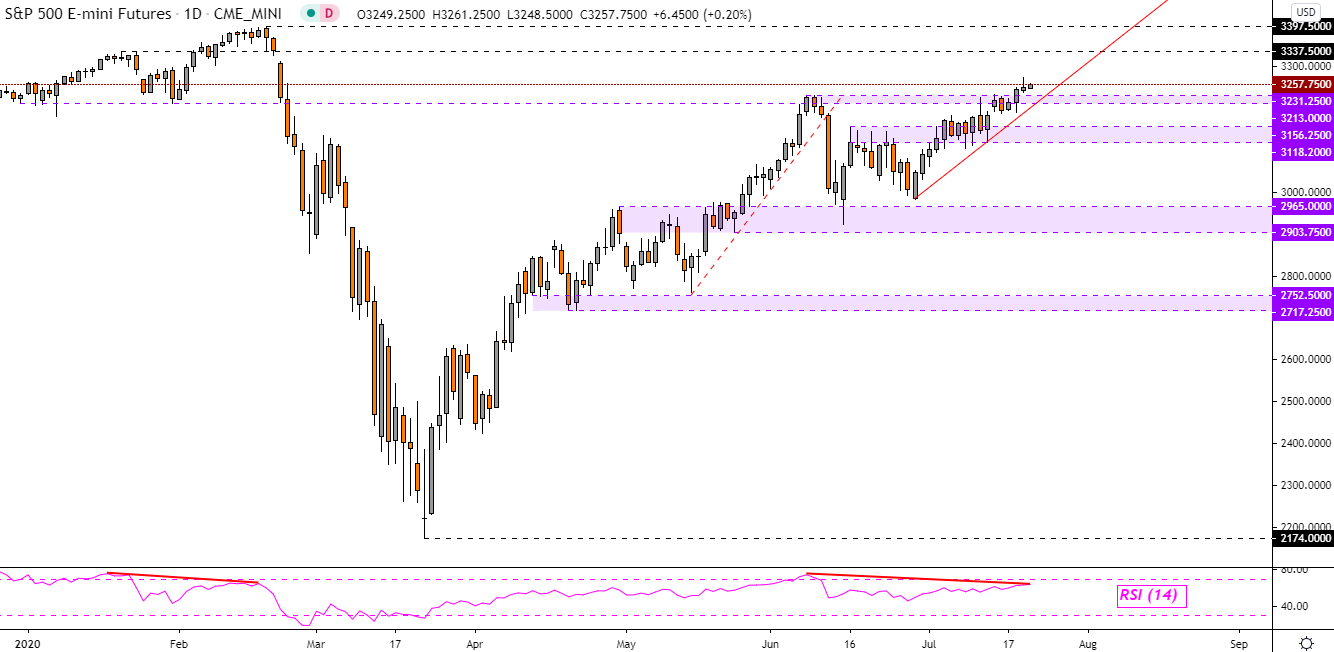
S&P 500 Chart Created in Trading View
*IG Client Sentiment Charts and Positioning Data Used from July 21 Report
--- Written by Daniel Dubrovsky, Currency Analyst for DailyFX.com
To contact Daniel, use the comments section below or @ddubrovskyFX on Twitter


