


BTC/USD Price Technical Outlook
BTC/USD – Indecisive Traders
On June 15, Bitcoin declined to a near three-week low at $8,911.The price rallied after and settled above the $9,000 handle nonetheless, the weekly candlestick closed in the red with a 1.5% loss.
Alongside this, the Relative Strength Index (RSI) remained flat around 50 reflecting the lack of impulse to trade in a clear direction.
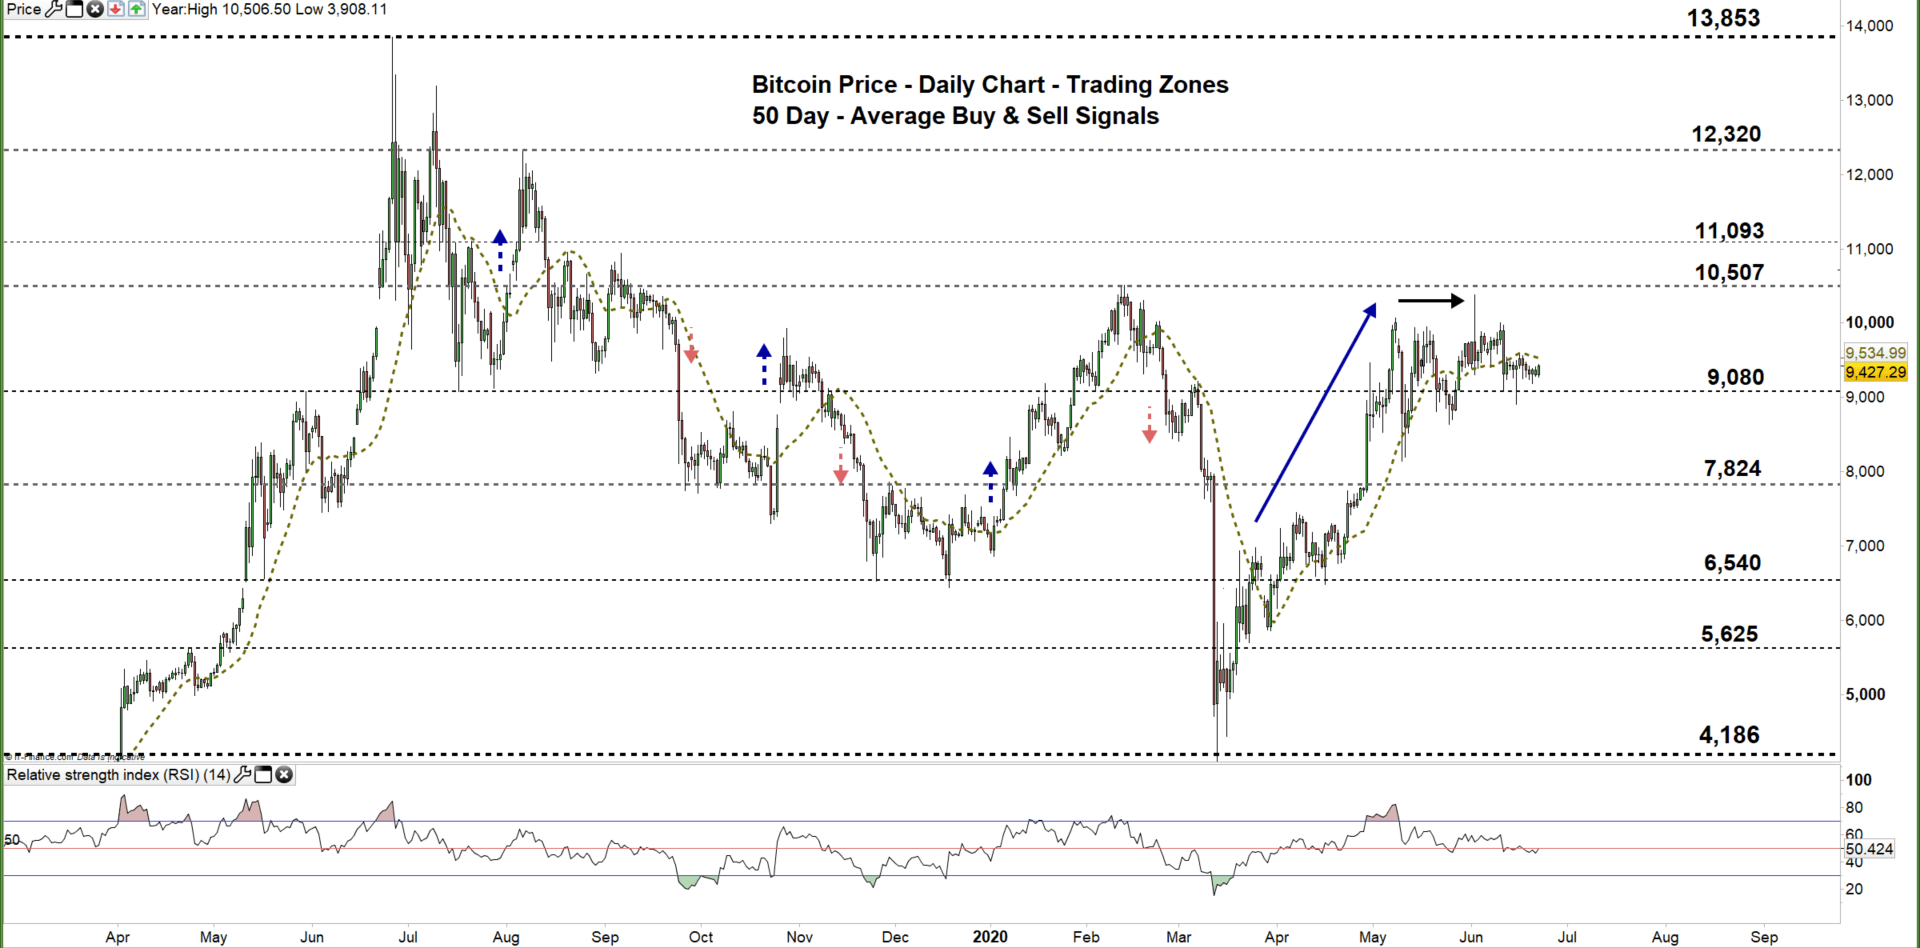
Bitcoin PRICE DAILY CHART (MaR 1, 2019 – June 22, 2020) Zoomed Out

Bitcoin PRICE DAILY CHART (April 20 – June 22, 2020) Zoomed In
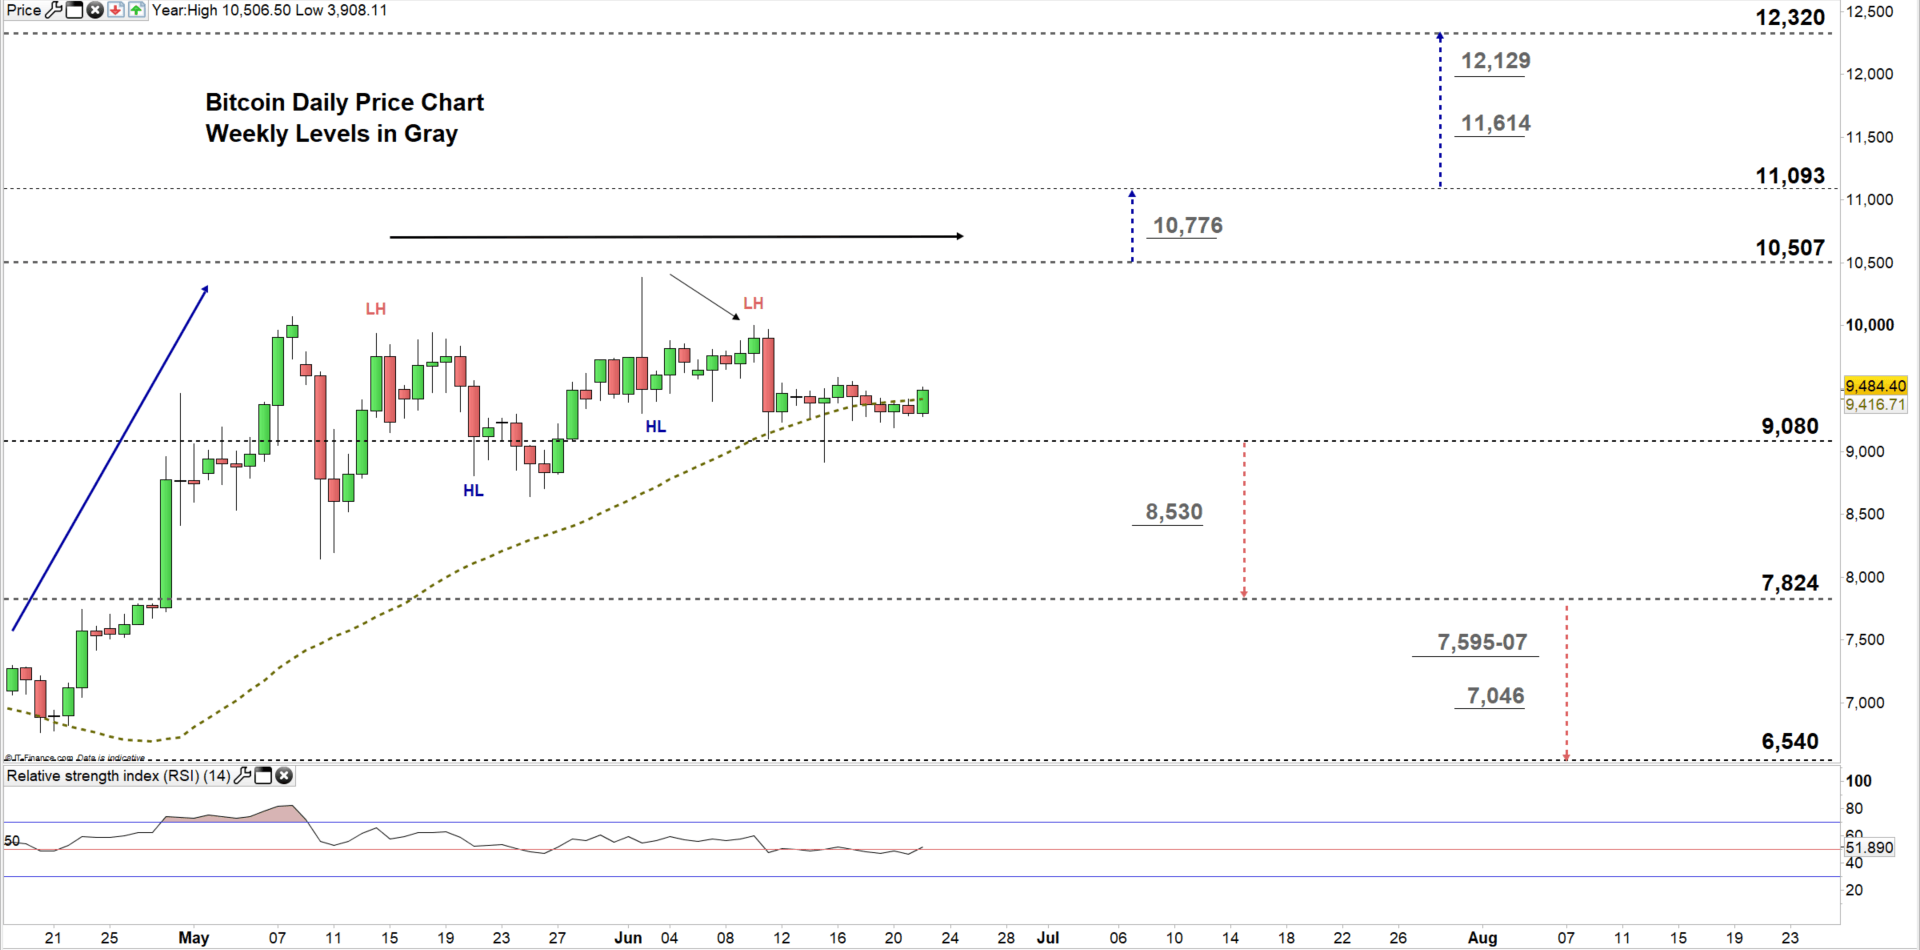
On June 10, Bitcoin created a lower high at 10,002 highlighting bull’s hesitation to control the price action. Last week, the cryptocurrency failed to decline to the lower trading zone signaling bear’s weakness at this stage.
A close above the 50-day moving average would generate a bullish signal and may trigger a rally towards the high end of the current trading zone $9,080 - $10,507. Any further close above this level would end the sideways move and could extend the rally towards $11,093.
In turn, a close below the low end of the zone reflects bulls’ weakness and could send BTC/USD towards $7,824. Any further close below that level could embolden bears to press towards $6,540.
See the daily chart (zoomed in) to know more about the key levels to monitor in both scenarios.

Bitcoin PRICE FOUR Hour CHART (May 26– June 22, 2020)
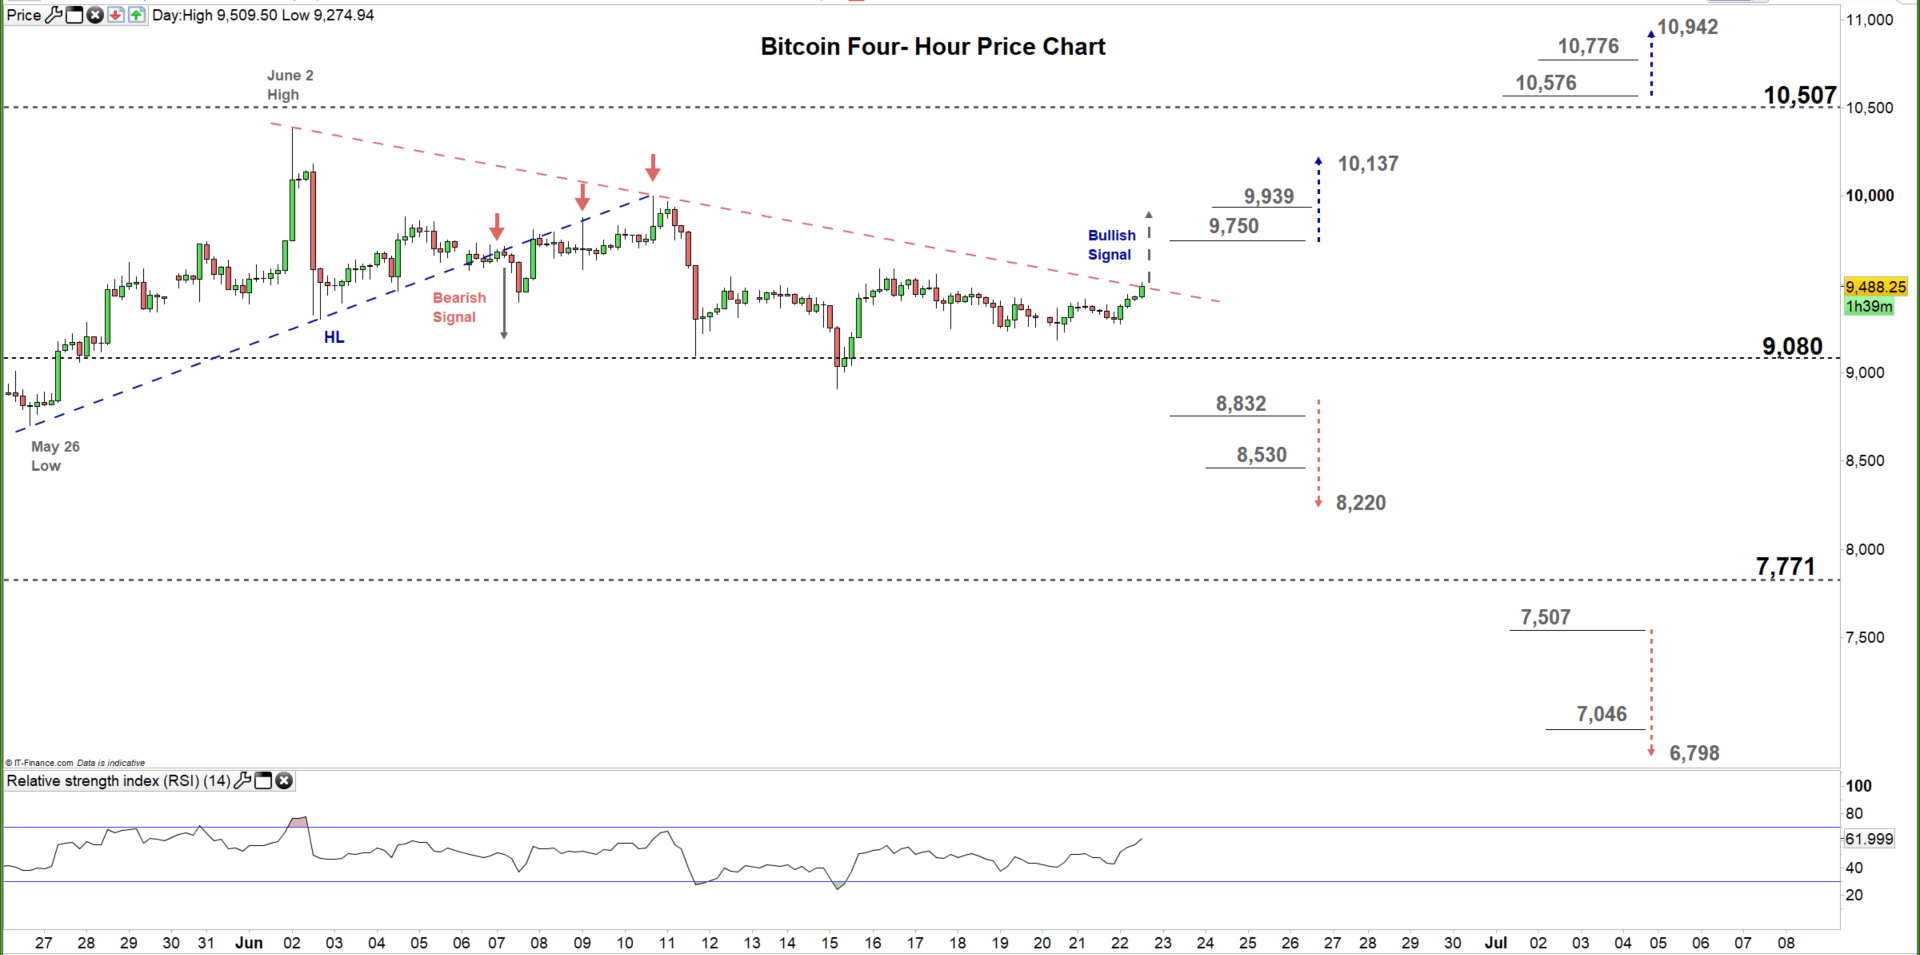
On June 6, Bitcoin broke below the uptrend line originated from the May 26 low at $8,701, and generated a bearish signal. Later on, the price failed on multiple occasions to rally above the aforementioned line reflecting bull’s weakness. With that said, any violation of the downtrend line originated from the June 2 high at $10,382 would be considered a bullish signal.
Thus, a break above $9,750 may cause a rally towards $10,137 on the other hand, any break below $8,832 could send BTC/USD towards $8,220. Nonetheless, the daily support and resistance underlined on the four-hour chart should be watched closely.

Written By: Mahmoud Alkudsi, Market Analyst
Please feel free to contact me on Twitter: @Malkudsi


