


BTC/USD Price Technical Outlook
- From bearish to bullish
- Bullish signals on Bitcoin price chart
BTC/USD – Fading Bullish Momentum
On May 18, Bitcoin printed $9,947 then reversed lower returning the majority of the previous week’s gains. As a result, the weekly candlestick closed in the red with a 0.4% loss.
Alongside this, the Relative Strength Index (RSI) fell from 63 to 53 highlighting that bulls were losing momentum.
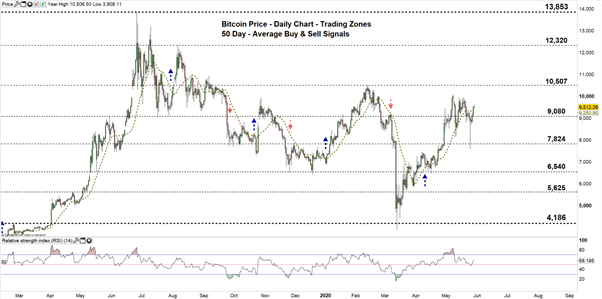
Bitcoin PRICE DAILY CHART (MaR 1, 2019 – May 29, 2020) Zoomed Out

Bitcoin PRICE DAILY CHART (March 17 – May 29, 2020) Zoomed In
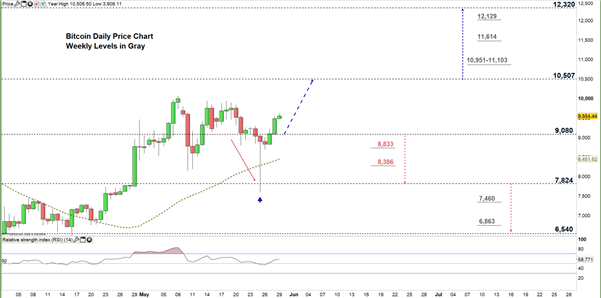
At the start of this week, Bitcoin declined to four-week low at $7,598 then rallied after, reflecting bears’ hesitation to control the price action. Later on, the cryptocurrency climbed to the current trading zone $9,080 -10,507 eyeing a test of the high end of it.
A close above the high end of the aforementioned zone indicates that bulls may push towards $12,320. Having said that, the weekly resistance levels underscored on the chart (zoomed in) should be monitored.
On the flip side, any failure in closing above the high end of the zone highlights a weaker bullish sentiment. This may reverse the price’s direction towards the low end of the zone. A further close below that level could send BTC/USD even lower towards $6,540. In that scenario, the daily and weekly support levels marked on the chart should be kept in focus.

Bitcoin PRICE FOUR Hour CHART (May 7– May 29, 2020)
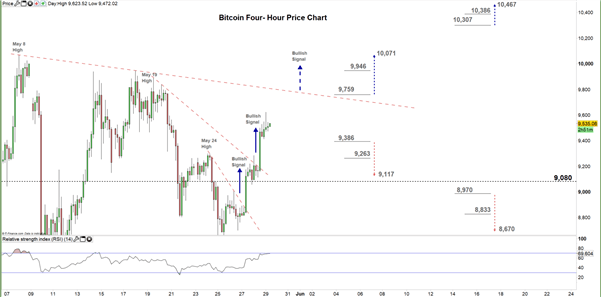
This week, Bitcoin has generated two bullish signals as rallied above two downtrend lines ( see the four-hour chart). Another bullish signal would be produced if the price violates the downtrend line originated from the May 8 high at $10,071.
Thus, a break above $9,759 may trigger a rally towards the aforementioned May 8 high. On the other hand, a break below $9,386 could send BTC/USD towards $9,117. Needless to say that, the daily support and resistance underlined on the chart should be watched closely.

Written By: Mahmoud Alkudsi, Market Analyst
Please feel free to contact me on Twitter: @Malkudsi


