


US DOLLAR TECHNICAL FORECAST: BULLISH
- US Dollar volatility has settled after March’s Covid-19 turmoil
- A bullish breakout has managed to survive seesaw price swings
- Break of 6-week consolidation band suggests uptrend resuming
US Dollar volatility has settled somewhat. Weekly rate of change (ROC) studies on an average of the Greenback’s value against its major counterparts have returned to levels prevailing before activity exploded in March against the backdrop of the Covid-19 coronavirus outbreak.
At that time, worries about an imminent credit crisis sent capital scrambling for cash. The unrivaled liquidity appeal of the top global reserve currency sent it flying upward. It recoiled back with equal vigor as the Federal Reserve unleashed a barrage of bold easing measures to rein in funding costs.
Perhaps most notably, all this commotion has left conspicuously intact USD’s breach above resistance established in December 2016 and capping gains since then. The Fed-inspired selloff landed squarely at this barrier – now recast as support – and prices have tellingly stalled there since.
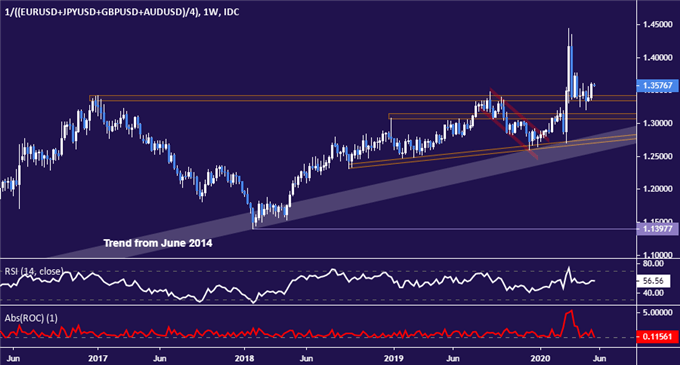
US Dollar weekly chart created with TradingView
Zooming in to the daily chart, it now appears as though prices may be ready to make good on this resilience. Prices finished last week with a break and close above resistance containing consolidation since early April, suggesting the next phase of the structural advance may be at hand.
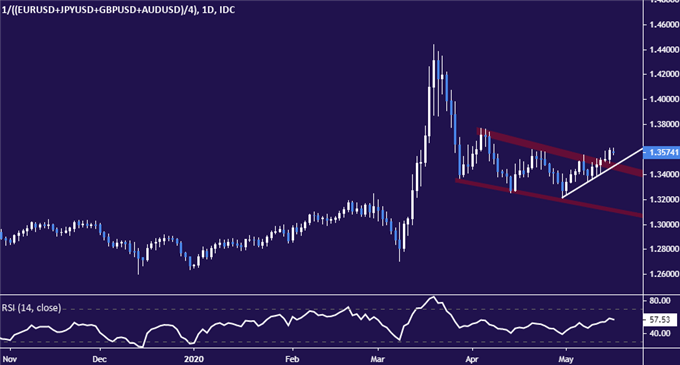
US Dollar daily chart created with TradingView

US DOLLAR TRADING RESOURCES
- Just getting started? See our beginners’ guide for FX traders
- What is your trading personality? Take our quiz to find out
- Join a free webinar and have your trading questions answered
--- Written by Ilya Spivak, Head APAC Strategist, DailyFX
To contact Ilya, use the comments section below or @IlyaSpivak on Twitter


