


BTC/USD Price Technical Outlook
BTC/USD – Bulls Ease up
On Friday, Bitcoin took off to a near three month high at $10.071. Afterward, the price retreated and settled below the $10.000 handle as some bulls seemed to cut back. Yet, the market closed the weekly candlestick with a 14.0 % gain.
This week, the Relative Strength Index (RSI) has fallen from 70 to 52 highlighting a weaker bullish momentum.
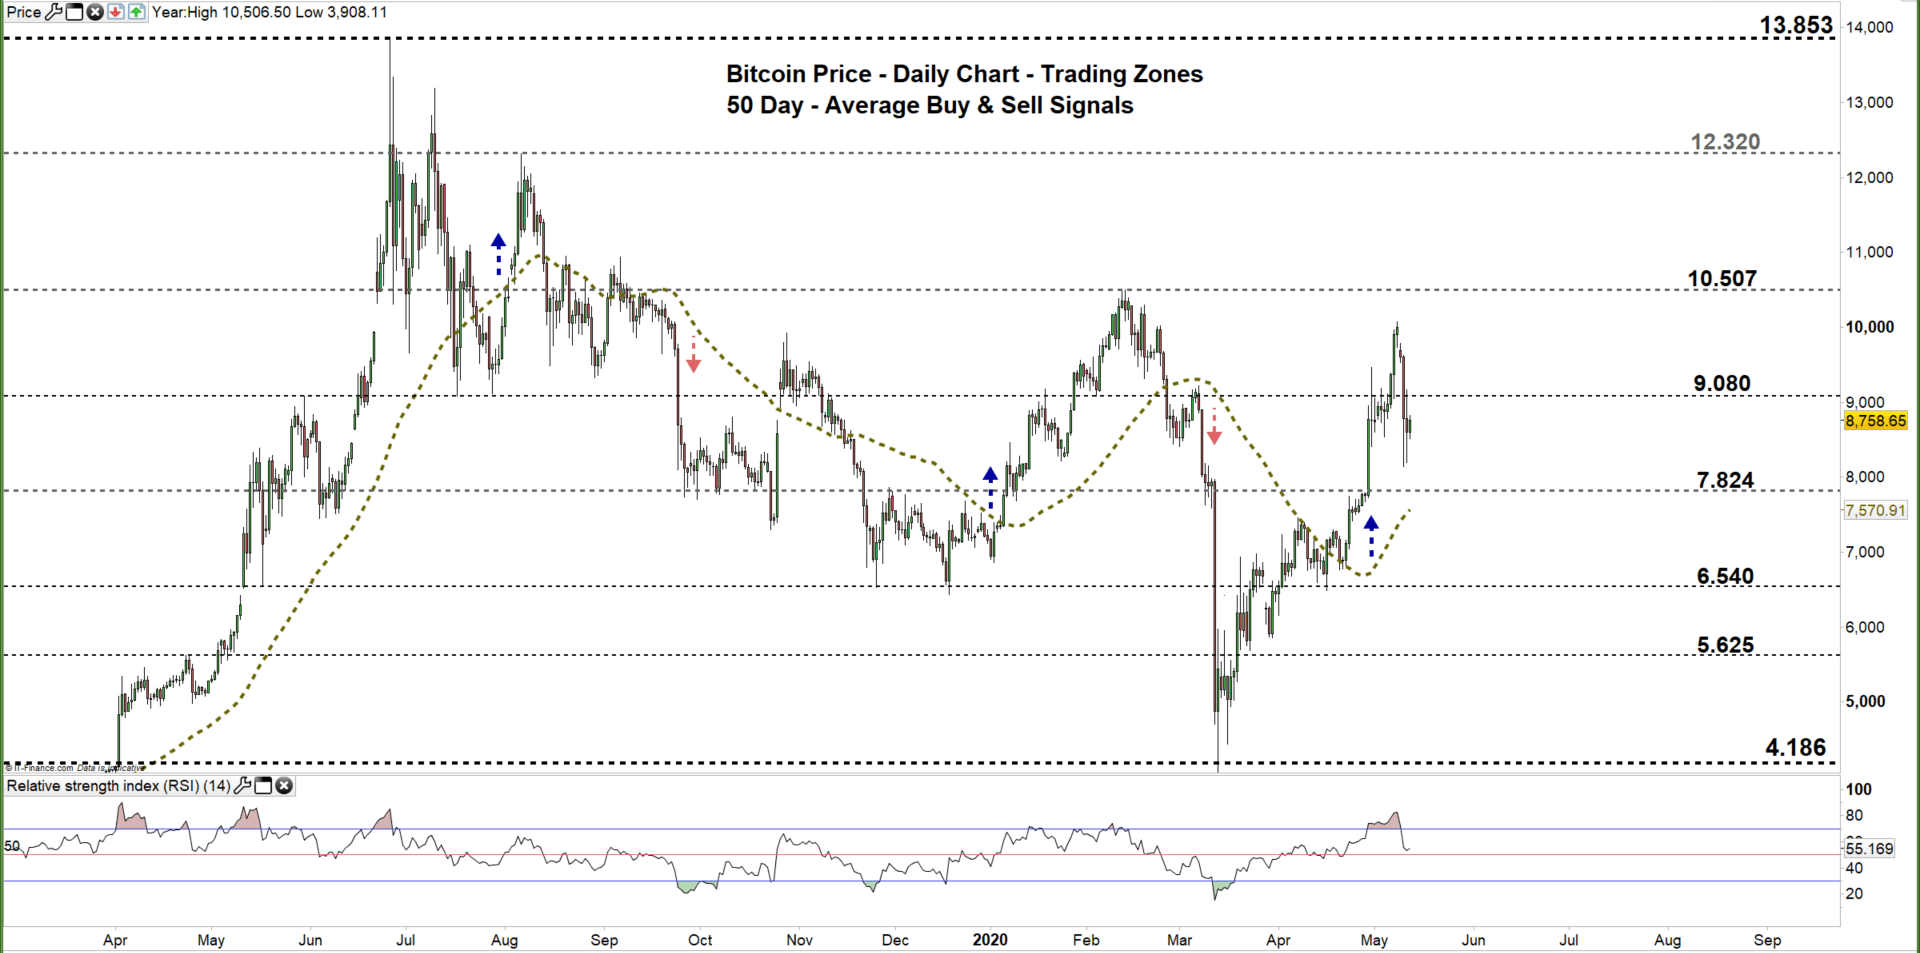
Bitcoin PRICE DAILY CHART (MaR 15, 2019 – May 12, 2020) Zoomed Out

Bitcoin PRICE DAILY CHART (March 12 – May 12, 2020) Zoomed In

Based on the daily chart analysis, on Sunday the price corrected its uptrend and declined to the current trading zone $7.824 - $9.080. Yesterday, Bitcoin failed to return to the previous zone signaling a possible fall towards the low end of the aforementioned zone.
A close below the low end of the zone could encourage bears to press towards $6.540. A further close below that level may send BTC/USD even lower towards $5.625. In that scenario, the weekly support levels underlined on the chart should be considered.
On the other hand, any failure in closing below the low end of the zone may reverse the market’s direction towards the high end. A further close above that level could trigger a rally towards $10.507. That said, the daily and weekly resistance levels marked on the chart should be watched closely.

Bitcoin PRICE FOUR Hour CHART (April 21 – May 12, 2020)

Looking at the four-hour chart, in mid-April the market broke above the downtrend line originated from the April 7 high at $7.455 then started a bullish momentum creating higher highs with higher lows. On Sunday, Bitcoin broke below the uptrend line originated from April 21 low at $6.772 eyeing a test of the low end of the current trading zone discussed above on the daily chart.
A break below $7.770 reflects a stronger bearish sentiment and could send BTC/USD towards $7.316. Although, the weekly support level underscored on the chart should be kept in focus. In turn, any break in the other direction i.e. above $9.216 may cause a rally towards $9.648. Nonetheless, the daily resistance level printed on the chart should be monitored.
See the chart to know more about the critical levels in a further bearish/ bullish move.
Read More: Bitcoin Price: How Will Halving, Coronavirus After BTC?

Written By: Mahmoud Alkudsi, Market Analyst
Please feel free to contact me on Twitter: @Malkudsi


