


BTC/USD Price Technical Analysis
BTC/USD – Bulls In Charge
On Thursday, Bitcoin printed its highest level in six weeks at $7.744 then retreated after, as some bulls seemed to cut back. Yet, on Friday the weekly candlestick closed in the green with a 6.6% gain.
Alongside that, the Relative Strength Index (RSI) rose from 50 to 61 emphasizing the bullish outlook of the market.
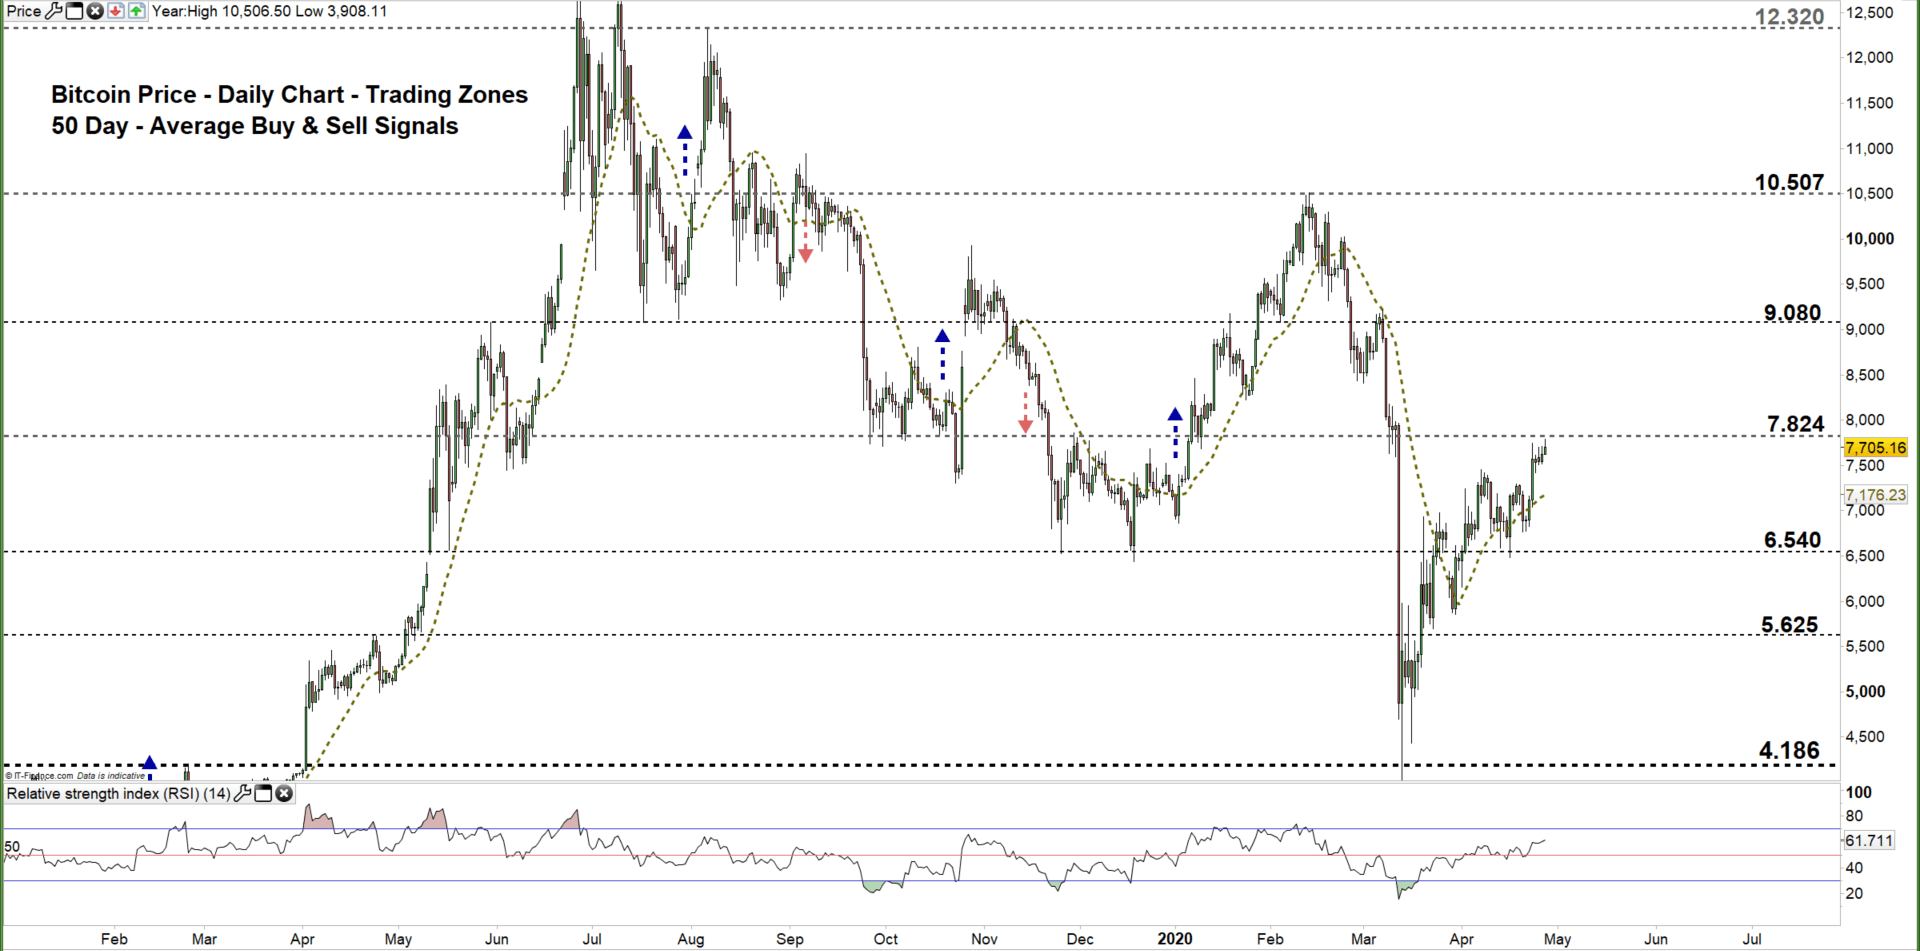
Bitcoin PRICE DAILY CHART (Jan 15, 2019 – April 27, 2020) Zoomed Out

Bitcoin PRICE DAILY CHART (FEB 20 – April 27, 2020) Zoomed In
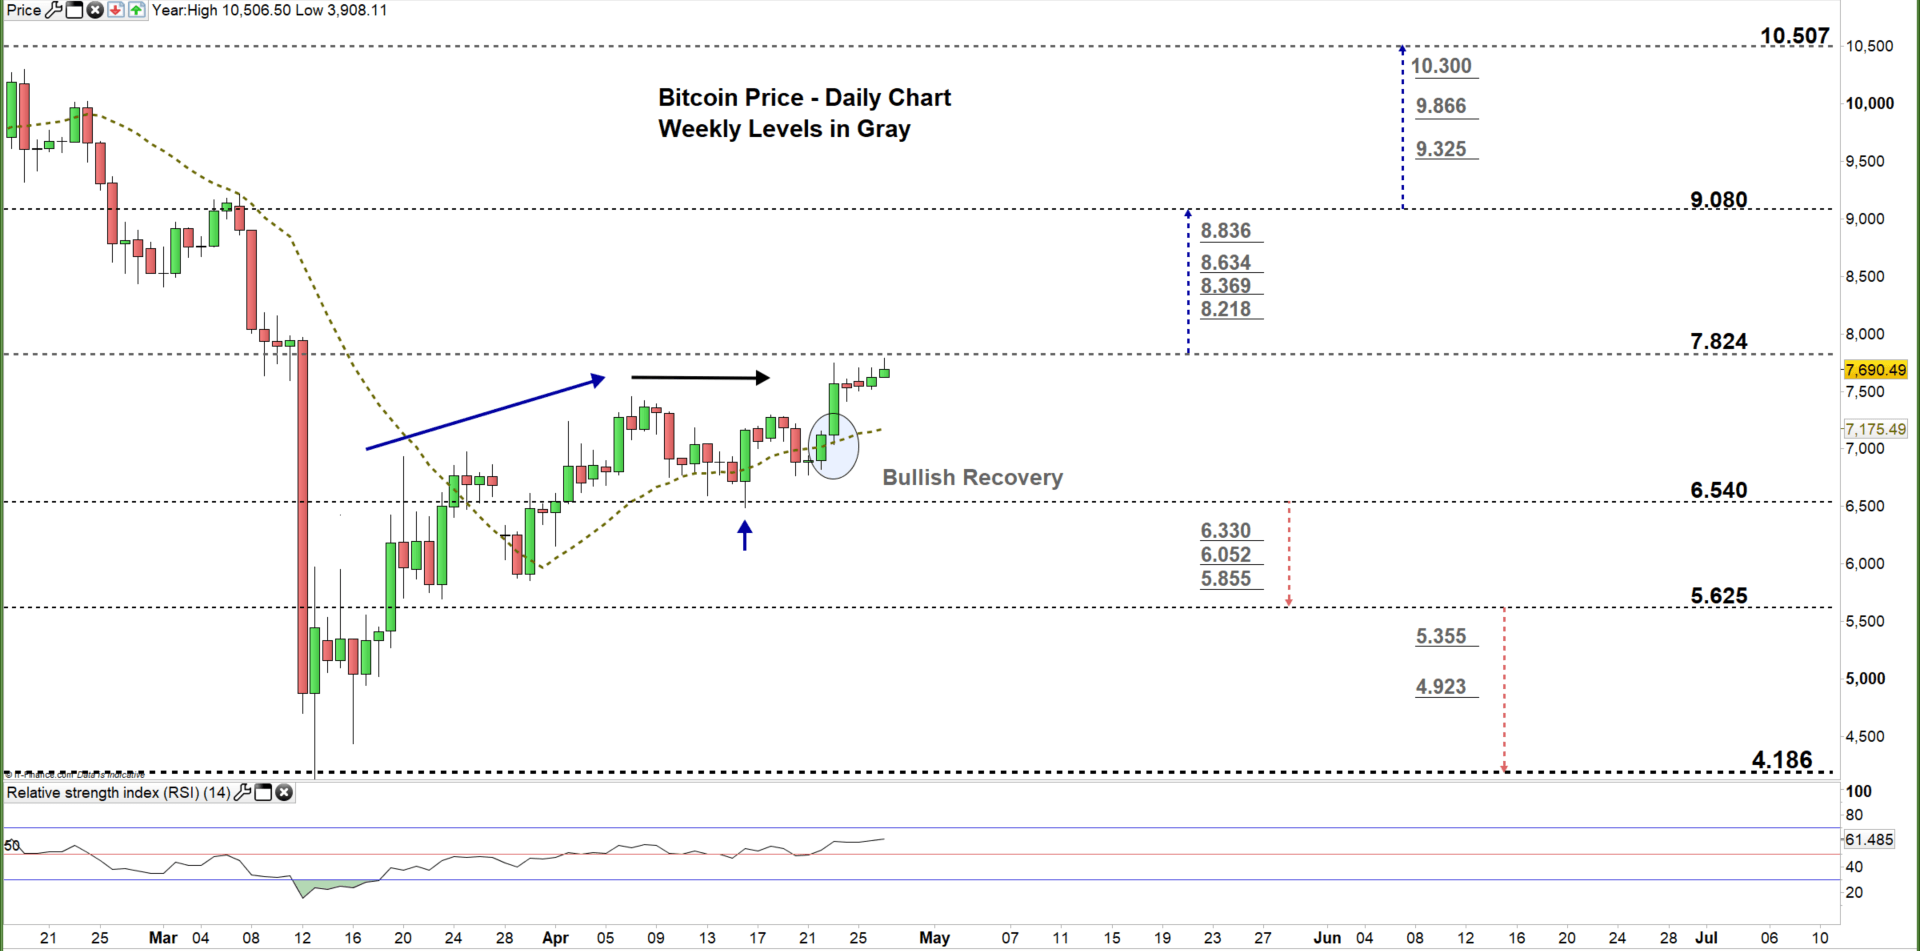
Looking at the daily chart, I noticed that in late March Bitcoin started uptrend creating higher highs with higher lows. On April 7, the market peaked at $7.455 then traded in a sideways move. On Wednesday, the price closed above the 50-day moving average reflecting that bulls were back. Today, Bitcoin broke above the aforementioned April 7 peak eyeing a test of the high end of the current trading zone $6.540 - $7.824.
A close above the high end of the zone may encourage bulls to push BTC/USD towards $9.080. A further close above that level could extend this rally towards $10.507. Yet, the weekly resistance levels underscored on the chart (zoomed in) would be worth monitoring.
On the other hand, any failure in closing above the high end of the zone reflects the bull’s hesitation. That being said, it would require more than one failure to conclude a weakening bullish momentum. In that scenario, BTC/USD may retreat towards the low end of the zone. A further close below that level might send the price even lower bears to press towards $5.625.

Bitcoin PRICE FOUR Hour CHART (April7 – April 27, 2020)

Looking at the four-hour chart, I notice that on April 20, the market rebounded from the downtrend line originated from the April 7 high at $7.455, highlighting that bulls were not done. Later on, the price developed a bullish pennant pattern. Today, the price broke above the higher line of the pennant generating a bullish signal.
A break above $7.965 would be considered another bullish signal. This may cause a rally towards $8.369. Although, the weekly resistance level printed on the chart should be kept in focus. In turn, any break in the other direction i.e. below $7.317 could send BTC/USD towards $6.797. Nevertheless, the daily support level marked on the chart should be watched closely.
See the chart to know more about the critical levels in a further bearish/ bullish move.
Read More: Bitcoin Price: How Will Halving, Coronavirus After BTC?

Written By: Mahmoud Alkudsi, Market Analyst
Please feel free to contact me on Twitter: @Malkudsi


