


Natural Gas Technical Forecast
- Buying pressure eases up
- Will bulls stay in charge?
Natural Gas Price – Edging Higher
On Thursday, natural gas rebounded from $1,653 then surged and settled above $1.800 handle. On Friday the market continued its rally and closed the weekly candlestick in the green with a 3.3% gain.
This week, the Relative Strength Index (RSI) fell from 63 to 54 highlighting weaker bullish momentum.
Nat-Gas DAILY Price CHART (Jan 2, 2019 – April 24, 2020) Zoomed Out


Natural Gas DAILY Price CHART (Jan 22 – April 24, 2020) Zoomed IN

Looking at the daily chart, we noticed that this week the price rallied above the downtrend line originated from the Jan 14 high at $2.225 eyeing a test of $2.139. However, Natural gas failed on multiple occasions to close above the high end of the current trading zone $1.850 - $2.050 reflecting bull’s hesitation at this point.
A close below the low end of the zone could send the price towards $1.655. Further close below that level opens the door for bears to take charge and press towards $1.430. Although, the daily support levels and weekly support area marked on the chart (zoomed in) should be considered.
On the flip side, any failure in closing below the low end of the zone may cause a rally towards the high end of the zone. Further close above that level could extend this rally towards $2.139. That said, the weekly resistance levels underlined on the chart should be kept in focus.

Natural Gas price Four-Hour PRICE CHART (Mar 25 – April 24, 2020)
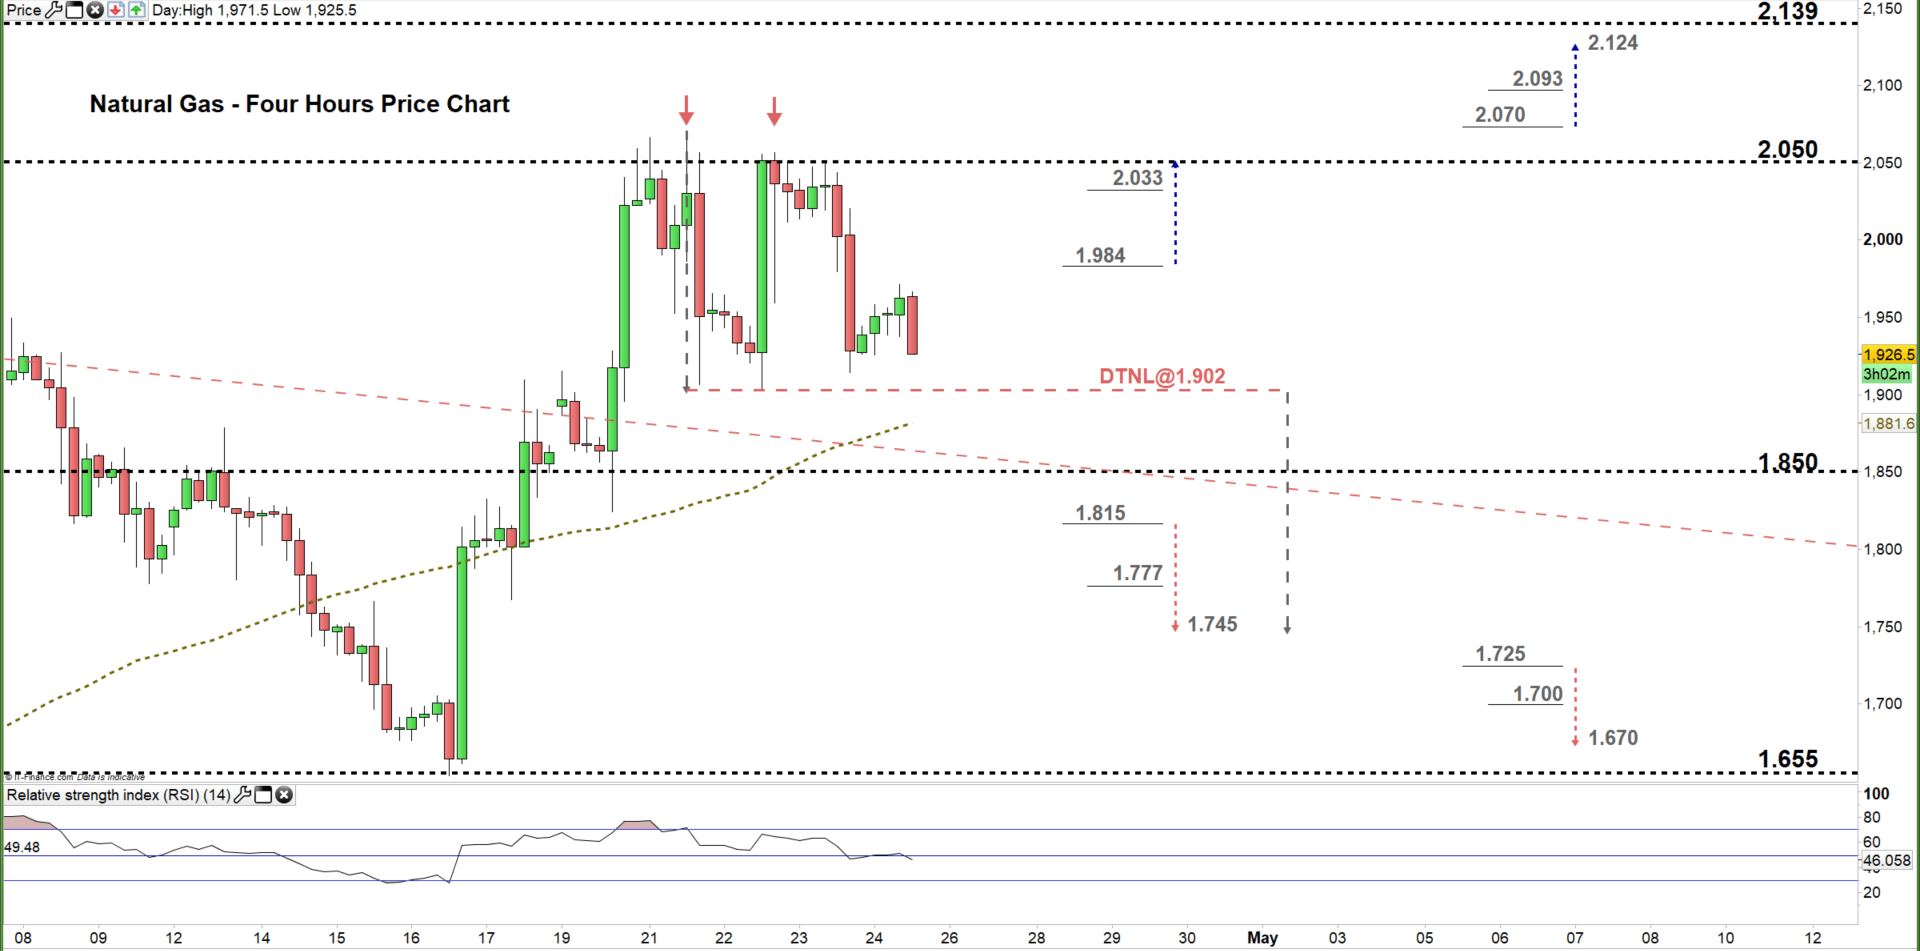
From the four- hour chart, we noticed that on April 22 Natural gas corrected its uptrend and created a lower high at $2.056. The price fell after and developed a double top pattern. Any violation of the neckline of this pattern would be considered a bearish signal.
A break below $1.815 would be considered an additional bearish signal. This could send the price to $1.745.Yet, the daily support level underscored on the chart should be monitored. In turn, a break in the other direction i.e. above $1.984 might cause a rally towards $2,050. In that scenario, the daily resistance printed on the chart would be worth monitoring.
See the chart to find out more about the key technical levels to keep in mind in a further bullish/bearish scenario.
Written By: Mahmoud Alkudsi, Market Analyst
Please feel free to contact me on Twitter: @Malkudsi


